MACD vs RSI — Which Should You Use, and When?
MACD is trend-momentum (zero-axis, unbounded); RSI is mean-reversion (0–100). Comparison table, regime-aware framework, combined workflow.
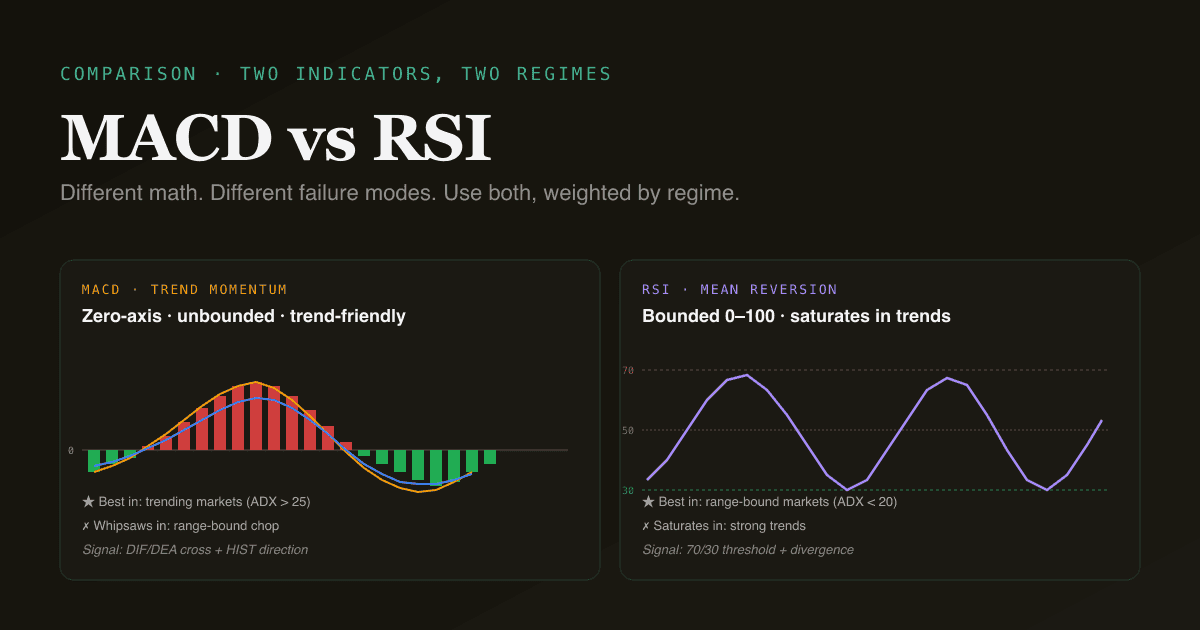
MACD and RSI are the two most-quoted indicators in retail technical analysis, and they answer fundamentally different questions. MACD measures momentum — the rate of change of a fast moving average relative to a slow one. RSI measures relative strength — the magnitude of recent gains versus recent losses. They share the word "momentum" in casual usage, but they fail in different market regimes. Knowing which to use, and when, is more useful than knowing either of them deeply in isolation.
Key takeaways
- MACD is a trend-momentum indicator (zero-axis, no upper bound) — best for "is the trend regime changing?"
- RSI is a mean-reversion indicator (0–100 bounded, 70/30 thresholds) — best for "has price stretched too far?"
- Use MACD as the trend confirmation, RSI for divergence and extreme readings — they complement, not substitute.
- In strong trends, RSI saturates; MACD keeps generating useful information. This is the single biggest practical difference.
- The PickSkill summary view shows both side-by-side — see /indicators.
What does each indicator actually measure?
| Property | MACD | RSI |
|---|---|---|
| Inputs | 12-, 26-, 9-period EMAs of close | 14-period Wilder-smoothed gains and losses |
| Centred on | Zero (DIF can be positive or negative) | 50 (RSI bounded 0–100) |
| Primary signal | DIF/DEA cross + HIST direction | Threshold crossings (70, 30) + divergence |
| Failure mode | Whipsaws in range-bound chop | Saturates in strong trends |
| Best regime | Trending markets | Range-bound markets |
| Typical use | Trend confirmation, entry timing | Mean-reversion, divergence, exhaustion |
| Direction | Has direction (DIF sign) | Has level (no inherent direction) |
The fundamental difference: MACD takes the difference between two trend lines and tracks whether momentum is accelerating or decelerating; RSI takes the ratio of recent gains to recent losses and tracks whether the asset is statistically extended. Different math, different signal.
When is MACD better than RSI?
Trending markets. When a stock is in a clean trend — ADX above 25, price above 60-day moving average, MACD already above its zero line — RSI loses signal value (it stays above 70 the whole time), while MACD continues to provide useful information:
- HIST expansion tells you the trend is accelerating.
- HIST contraction tells you the trend is decelerating (early warning).
- A death cross above the zero axis is a high-quality trend-rolling-over signal.
Quoting MACD in a clean trend gives you continuous information; quoting RSI gives you a constant "75. 78. 82. 80. 78." reading that means very little.
When is RSI better than MACD?
Range-bound markets. When a stock is grinding sideways — ADX below 20, price oscillating around its 60-day moving average, no clear trend — MACD generates dozens of false golden / death crosses per quarter. None of them have meaningful predictive value, because there is no trend for the momentum to attach to.
RSI, in the same regime, behaves well. It cycles between 30 and 70 with relatively low whipsawing, and the threshold crossings actually correspond to mean-reverting price action. Buying RSI 30 and selling RSI 70 in a confirmed range is one of the few simple rules that historically has real edge.
The crisp summary: MACD trusts the trend; RSI fights the trend. Use whichever matches the underlying regime.
What about divergence?
Both indicators support divergence analysis, but RSI divergence has a longer track record and is more widely cited in practitioner literature:
- RSI divergence is unambiguous because RSI is bounded. A higher high in price with a lower high in RSI is visually obvious and well-defined.
- MACD divergence is most often watched on the histogram (HIST) rather than on DIF. Because HIST can shrink without going through zero, divergence is detectable earlier than waiting for a cross — but is also more prone to false signals.
For divergence specifically, RSI wins for clarity. For confirming that divergence with a separate momentum signal, MACD's cross is the canonical confirmation event. The combined workflow — spot the divergence on RSI, confirm with the MACD cross — is the standard professional setup.
How do MACD and RSI fail differently in A-share markets?
Both indicators are affected by daily price limits, but in different ways:
- MACD: Limit-up streaks create a staircase pattern in EMA(close). The DIF line moves smoothly but with delay; the cross may happen 1–2 bars late relative to a free-trading market. Information loss: timing precision.
- RSI: Limit-up streaks push RSI toward saturation (close-minus-prev-close is positive every day during the streak). RSI may sit at 95+ for the duration of the streak, providing no usable information. Information loss: signal value.
For A-share short-term workflows, MACD's "delayed but real" signal is more usable than RSI's "saturated but technically correct" reading. For longer-term swing setups on the same A-share names, RSI divergence remains useful — daily limits affect the absolute level of RSI but do not eliminate divergence patterns.
The PickSkill dashboards compute both for every holding and mark limit days as neutral in the bucket trail, so signal quality on A-share names stays comparable to non-limit markets.
The combined workflow most professionals actually use
Three steps, in order:
- Identify the regime with ADX (or visually: is the stock trending?). Above 25 = trend. Below 20 = range. Between = uncertain.
- In a trend: trust MACD signals (golden / death crosses, HIST inflections), be skeptical of RSI threshold readings (they saturate). Use RSI only for divergence in this regime.
- In a range: trust RSI signals (70/30 crossings, mean reversion), be skeptical of MACD crosses (they whipsaw). Use MACD only for the macro direction of the underlying drift, not for entry timing.
This is what "use both indicators" actually means in practice — not blindly stacking them, but switching which one you weight based on the regime. The PickSkill summary view renders MACD, RSI, and ADX columns side-by-side so the regime read and the corresponding indicator weight are a single scan.
See it on your portfolio. The /indicators page shows MACD and RSI for every holding, with a 5-day bucket trail under each, so you can see how the signals are evolving across the trading week.
Common mistakes when comparing MACD and RSI
- Treating them as substitutes. They measure different things. Picking one and ignoring the other is leaving free information on the table.
- Using both without regime context. Stacking both indicators without an ADX filter means you'll get whipsaw signals from MACD in chop, plus saturated readings from RSI in trends — the worst of both.
- Confusing MACD with the MACD histogram. When traders say "MACD is bullish," ask what they mean — is DIF above DEA, is HIST above zero, or did HIST just expand on the latest bar? All three are MACD signals, and all three trigger at different times.
- Expecting RSI to predict the top. RSI tells you when price has stretched; it does not tell you when the stretch will resolve. Many strong stocks stay above 70 for weeks.
Further reading
- Investopedia: MACD vs RSI — additional comparison framework with worked examples.
- Murphy, Technical Analysis of the Financial Markets (1999) — chapter-length coverage of when momentum oscillators agree, disagree, and what to do when they conflict.
FAQ
Which is more reliable, MACD or RSI? Neither, in isolation. MACD is more reliable in trending markets; RSI is more reliable in range-bound markets. Their reliability is regime-dependent — there is no universal answer. Most professional setups use both, weighted by regime.
Can I use both MACD and RSI together? Yes — but only with a regime filter (ADX is the standard choice). The pattern is: use ADX to identify the regime, then weight MACD or RSI accordingly. Stacking both without regime context produces conflicting signals.
Which is better for day trading? Neither, at short intraday timeframes. Both indicators are noisier on 1-minute and 5-minute bars; both produce false signals at unacceptable rates. For day trading, indicators built on shorter timeframes with explicit volatility scaling (e.g., VWAP-relative measures) tend to outperform the daily-bar standards on intraday data.
Is MACD older than RSI? RSI was published in 1978 by J. Welles Wilder. MACD was developed by Gerald Appel in the late 1970s as well. Both are roughly contemporaneous; both pre-date electronic charting. They survived because the math is genuinely useful — not because of timing.
Why does the same MACD/RSI combination work on US stocks and not on A-shares (or vice versa)? Because the underlying market microstructure differs. A-share daily price limits truncate the data the indicators consume; US after-hours moves get baked into the next open's gap and skew the early-bar EMAs. Same formulas, different inputs, different outputs. The PickSkill dashboards apply per-market adjustments (limit-day masking, halt handling) so the bucket signals are comparable across markets — but the raw indicator values will still differ.