What Is KDJ? The A-Share Stochastic, Explained Globally
KDJ uses a 9-day high-low range smoothed into K, D, and an amplified J line. The A-share standard oscillator — formula, signals, FAQ.
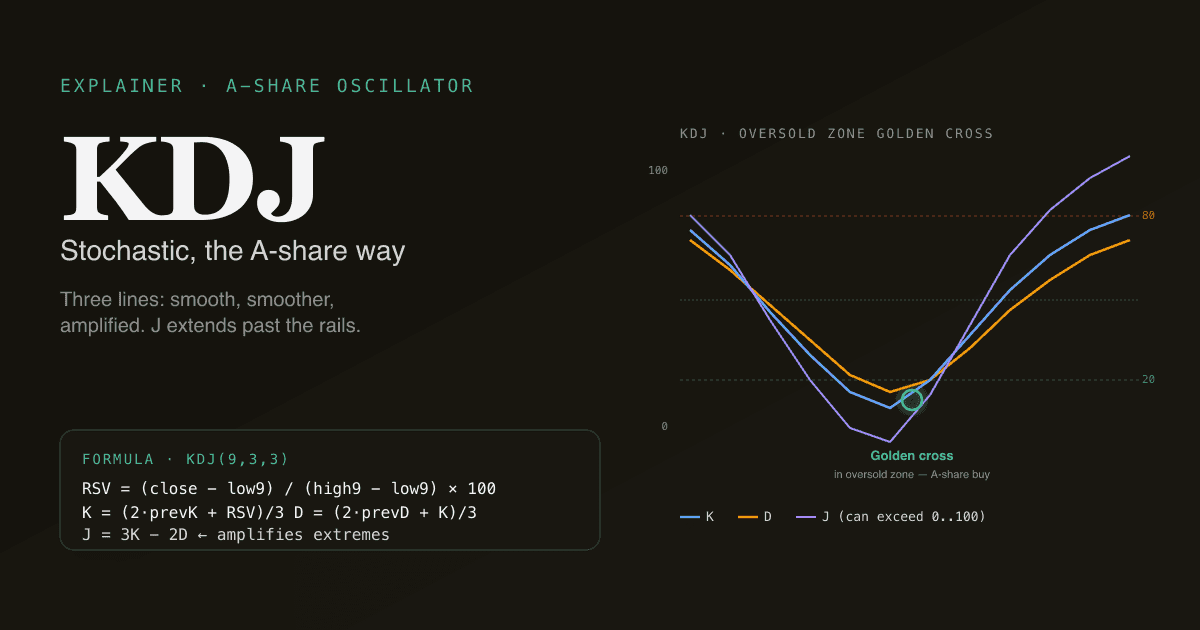
KDJ is a stochastic oscillator that combines a 9-day high-low range, a 3-period smoothed K line, a 3-period smoothed D line, and an unbounded J line (3K − 2D) that amplifies extremes. It is the default short-term oscillator on essentially every Chinese A-share charting platform — from 同花顺 (Tonghuashun) to 东方财富 (East Money) to mobile broker apps. KDJ is what KDJ stands for in Chinese retail trading culture. The math is universal; the cultural context is regional.
Key takeaways
- Three lines: K (responsive), D (smoothed), J (amplified). K and D oscillate between 0 and 100; J can exceed both ends.
- Golden cross = K crosses above D = bullish momentum. Death cross = K crosses below D.
- The strongest signals happen near the extremes. A golden cross with K and D both below 20 is the canonical A-share buy setup. A death cross with both above 80 is the sell setup.
- J going below 0 or above 100 is by design. It is the indicator screaming that price is at a statistical extreme — useful, not a calculation error.
- Available across US, HK, and A-share daily bars in the PickSkill indicator dashboards.
How is KDJ calculated?
KDJ uses the 9-period high-low range (the "fast" lookback). On every bar, compute the Raw Stochastic Value (RSV):
| Symbol | Meaning |
|---|---|
H9 | Highest high of the last 9 bars |
L9 | Lowest low of the last 9 bars |
RSV | (close − L9) / (H9 − L9) × 100 |
RSV is the percentile position of the current close within the recent range — 0 means at the low, 100 at the high. From RSV, KDJ derives three lines through Chinese-domain SMA smoothing (a recursive 1/3-weight formula):
| Line | Formula | Initial value |
|---|---|---|
| K | (2 × prev_K + RSV) / 3 | 50 |
| D | (2 × prev_D + K) / 3 | 50 |
| J | 3K − 2D | — |
J is intentionally unbounded — when K and D are both near the upper rail, 3K − 2D can exceed 100; when both are near the lower rail, J can go negative. That extreme reading is not a bug — it is the indicator's deliberate amplification of statistical edge cases.
What signals does KDJ generate?
The four canonical signals on a KDJ chart:
- Golden cross in the oversold zone (K < 20, D < 20, K crosses above D) — strongest bullish setup. The historical "底部 J 值翻红" (J turning positive from below zero) heuristic in A-share community lore corresponds to this pattern.
- Death cross in the overbought zone (K > 80, D > 80, K crosses below D) — strongest bearish setup. Used by short-term traders to exit before the pullback.
- Plain cross outside the extreme zones — directionally informative but lower confidence. Often whipsaws in choppy markets.
- Divergence between J and price — same logic as RSI divergence. J failing to make a new high while price does is bearish; J failing to make a new low while price does is bullish.
The KDJ buckets in the PickSkill indicator dashboards are tuned to the first two signals — extreme-zone crosses are the highest-quality of KDJ's outputs.
Why does J go negative — and what does it mean?
Because J = 3K − 2D. If K is at 5 and D is at 25 (both clearly oversold but K diving faster), 3 × 5 − 2 × 25 = 15 − 50 = −35. J at −35 means the close is much lower than the recent 9-day range suggests — possibly the lowest reading possible without a structural anomaly.
Practically, J below 0 is the indicator marking a very oversold extreme. Most experienced A-share traders will treat a J below 0 as a higher-conviction mean-reversion candidate than a plain K below 20. The symmetric reading for J above 100 holds for overbought.
Why is KDJ so popular in China?
Two reasons, and both matter for cross-market application.
First, the A-share market is dominated by retail flow (over 80% of trading volume comes from retail, vs. ~10–20% in US equities). Retail traders gravitate toward indicators with clear visual signals at well-defined levels. KDJ's two horizontal threshold lines (20, 80) and explicit cross events fit that mental model better than RSI's single line in a percentile band.
Second, A-share platforms standardised on KDJ early (mid-1990s, when domestic charting software first matured), and the conventions stuck. Almost every A-share teaching material on technical analysis includes KDJ as one of the first three indicators introduced (the other two are MA and MACD). A-share retail discourse — on 雪球, on broker community forums, on 富途 — uses KDJ vocabulary fluently. Knowing KDJ is part of speaking the language.
The implication: when researching A-share stocks, ignoring KDJ leaves a real interpretive gap. It is not that KDJ has more statistical edge than RSI on the same data — both are stochastic oscillators built on similar logic. It is that KDJ is the cultural common tongue.
How does KDJ behave on US stocks?
The math is identical. Two interpretive shifts apply:
- US equities are more institutionally driven, so the oversold-bounce dynamic that KDJ catches in A-share retail-driven swings is less pronounced. A J below 0 on AAPL is rarer and may indicate a different setup (forced selling, deleveraging cascade) than the same reading on a popular A-share name.
- Volatility regimes differ. Large-cap US equities trend more cleanly and oscillate less; KDJ generates fewer extreme-zone signals on AAPL or MSFT than on, say, 贵州茅台 (600519.SS).
KDJ still works on US stocks. It just signals less often, and when it does signal, the underlying dynamic is more likely to be macro-driven than retail-positioning-driven.
What are the four KDJ pitfalls?
- Trading every cross. Plain crosses outside the extreme zones (K > 30 < 70) generate one to two signals per week on liquid stocks — most of them whipsaws. Only the extreme-zone crosses have meaningful edge.
- Treating J as the entire signal. Some A-share traders watch only J — a fast indicator that flashes overbought / oversold readings on almost every meaningful move. The constituent K and D lines carry more stable information. J is the amplifier; K and D are the substance.
- Using KDJ on limit-up / limit-down days. A-share daily limits collapse the high-low range — when
high = low, RSV is undefined (division by zero). Most KDJ implementations fall back to the prior K and D values, freezing the indicator. The PickSkill dashboards detect these days and mark them as neutral in the bucket trail. - Comparing KDJ readings across timeframes. Daily KDJ at 80 is overbought on the daily timeframe; the weekly KDJ for the same stock might be at 50. Both readings are valid — they just describe different things. Don't conflate them.
How does KDJ pair with MACD?
KDJ is a fast, range-bound oscillator. MACD is a slower, zero-axis momentum indicator. They have different blind spots, which makes the pairing useful:
- KDJ catches the timing of short-term reversals; MACD confirms the trend regime.
- MACD golden cross + KDJ K crossing above D in the oversold zone = high-conviction buy setup. Cross-confirmation reduces the false-positive rate of both indicators.
- MACD death cross while KDJ stays above 80 = trend-confirmed top.
The PickSkill summary view renders MACD and KDJ side-by-side so this cross-confirmation is a glance, not a research session.
See it on your portfolio. /indicators shows KDJ across every holding with the K/D/J chart, the latest values, and a 5-day bucket trail.
Further reading
- Stochastic Oscillator on Investopedia — the Western-market parent of KDJ; explains the underlying RSV → K → D mechanic.
- George C. Lane's stochastic methodology, 1957 origins — historical context for the stochastic family of indicators KDJ extends with its J amplifier.
FAQ
Is KDJ better than RSI? Not better — different. KDJ has two smoothed lines that can cross (more signal events), explicit extreme thresholds (20/80 vs RSI's 30/70), and the J amplifier. RSI has one cleaner line and a longer signal-validation track record in Western academic literature. Most traders use KDJ for entry timing and RSI for divergence — they complement rather than replace each other. The PickSkill indicator dashboards ship both.
Why does KDJ sometimes "stop moving" for several days?
Most often this means the underlying chart has had several consecutive bars with high == low — typically A-share limit-up / limit-down days or a halted stock. RSV is undefined when high == low, so the implementation holds the prior K and D values. The PickSkill bucket layer marks these days as neutral in the 5-day signal trail.
Can I use KDJ on weekly charts?
Yes. Weekly KDJ generates fewer but higher-confidence signals than daily KDJ. Many A-share swing traders watch weekly KDJ for the regime and daily KDJ for entries. The default (9, 3, 3) parameters work on either timeframe.
Why is the J line sometimes negative or above 100? By construction. J = 3K − 2D, which has no upper or lower bound. Negative J means K is well below D (both already low); J above 100 means K is well above D (both already high). These extreme readings are stronger oversold / overbought signals than K and D individually.
Is KDJ useful for crypto? Yes. Crypto markets are even more retail-driven than A-shares and trade 24/7, so the short-term swing patterns KDJ catches are present. Many crypto traders use 14-period KDJ (slightly slower than the 9-period equity default) to filter out 24-hour noise.