Top 5 Technical Indicators for Chinese A-Shares
A-shares have ±10% limits, T+1 settlement, 80% retail flow. The 5 indicators that actually work: KDJ + MACD + MA60 + Volume + Capital Flow.
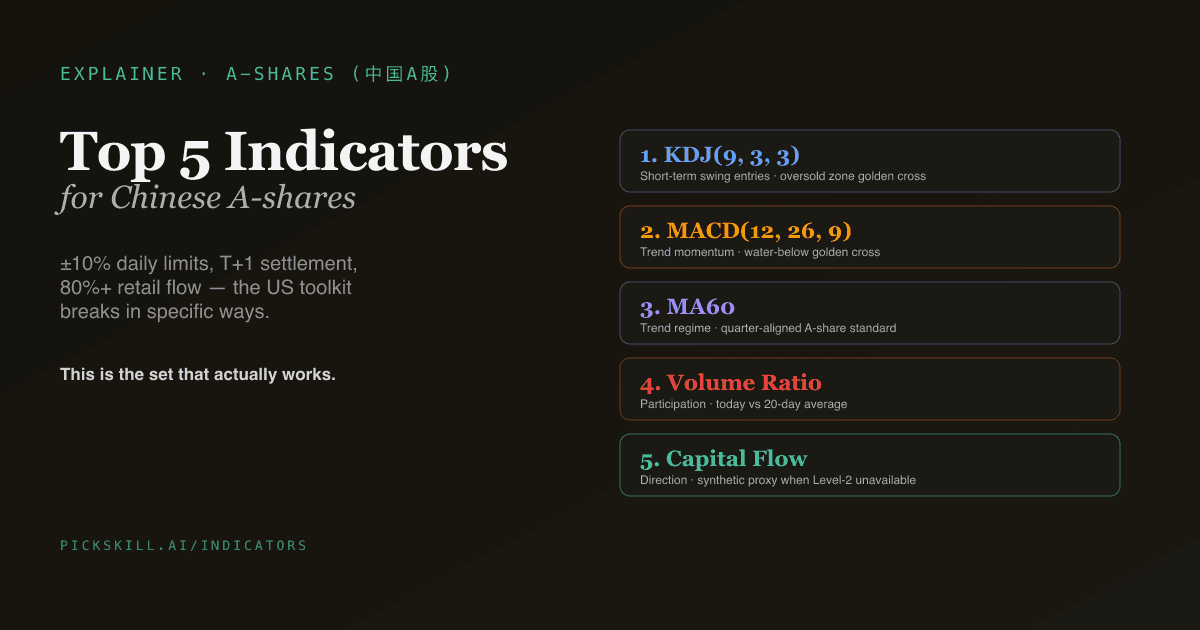
The best 5 technical indicators for Chinese A-shares are KDJ(9,3,3), MACD(12,26,9), MA60 (60-day moving average), Volume Ratio (today's volume divided by 20-day average), and a Capital Flow proxy. The standard US-style indicator toolkit — RSI, Bollinger Bands, Stochastic alone — runs into specific problems on A-shares: ±10% daily limits compress volatility and break RSI saturation logic; T+1 settlement changes volume interpretation; the 80%+ retail-driven order flow means KDJ's extreme-zone signals work better than they do on US large-caps. This is the set that actually works.
Key takeaways
- A-share market microstructure is different. ±10% (or ±20% / ±5%) daily price limits, T+1 settlement (no day-trading), 80%+ retail order-flow share. The standard US toolkit needs adjustments.
- 5 indicators, 5 different questions answered. KDJ for short-term swings, MACD for trend momentum, MA60 for trend regime, volume ratio for participation, capital flow for direction.
- Limit-day defenses matter. Every indicator on this list needs a limit-up / limit-down handler, or it will produce false signals during consecutive limit days.
- Cultural fluency matters. A-share retail discourse on 雪球, 富途, 同花顺 uses KDJ vocabulary natively. Knowing the indicator set means speaking the language.
- The PickSkill indicator dashboards ship all 5 with A-share-aware limit-day masking applied automatically.
Why the standard US indicator toolkit needs adjustment for A-shares
Three structural features of the A-share market change how indicators behave:
1. Daily price limits (±10% mainland mainboard, ±20% ChiNext/STAR Market, ±5% ST stocks). When a stock hits the limit, intraday range collapses — high == low == close == limit_price. This breaks any indicator that uses the daily range (KDJ's RSV, ADX's TR, Bollinger Bands' standard deviation). Most US-built indicator implementations don't have explicit limit-day handlers; they silently produce degenerate output.
2. T+1 settlement. Stock bought today cannot be sold until tomorrow. This changes volume interpretation: the heavy-buying-at-close pattern that signals institutional accumulation in the US doesn't have the same meaning when retail traders can't day-trade in the first place. Volume-based signals need to read "5-day cumulative pressure," not "today's intraday flow."
3. 80%+ retail order-flow share. A-shares are dominated by individual investors (vs. ~10–20% in US equities). This means short-term price action carries more emotional / coordinated-behaviour signal — exactly the regime where stochastic oscillators (KDJ in particular) work best. The same indicator generates higher-quality signals on A-shares than on, say, AAPL.
Net effect: some US-favoured indicators (RSI saturation thresholds, Bollinger Band touches as reversals) work less well; some Chinese-favoured indicators (KDJ, volume ratio, capital flow) work as well as or better than they do in their original market.
The 5-indicator set
1. KDJ(9,3,3) — for short-term swing entries
KDJ is the canonical A-share short-term oscillator. The default (9, 3, 3) parameters fit the typical A-share swing length (3–10 trading days). The two signals that matter:
- Oversold-zone golden cross (K and D both < 20, K crossing above D) — the classic A-share buy setup, the same pattern A-share retail traders call "底部 J 值翻红" (J turning positive from below zero).
- Overbought-zone death cross (K and D both > 80, K crossing below D) — short-term sell / take-profit signal.
Why it works on A-shares better than US: KDJ catches retail-driven oversold-bounce dynamics, which are more pronounced on A-shares (retail-flow-dominated). The J line extending below zero on extreme selloff days is a recurring tradable pattern.
Limit-day defense: Limit-down days have high == low, so RSV is undefined. Hold prior K/D values rather than divide-by-zero crashing. The PickSkill implementation does this and marks limit days as neutral in the bucket trail.
2. MACD(12,26,9) — for trend momentum
MACD works on A-shares with the same defaults as US. The interpretation of the indicator transfers cleanly; what differs is the visual convention (A-share platforms render histogram red-up / green-down, inverse of US).
The signal that matters most: water-below golden cross (DIF and DEA both below zero, DIF crossing above DEA) — a reversal-candidate signal on A-shares, particularly powerful coming out of a multi-week consolidation. A-share retail discourse references this as the "底部金叉" (bottom golden cross) setup.
Limit-day defense: Consecutive limit-up days create a stair-step in EMA(close); the golden cross may lag by 1–2 bars relative to a free-trading market. Read the histogram trajectory, not just the cross moment.
3. MA60 (60-day moving average) — for trend regime
A-share retail traders watch the 60-day moving average as the canonical "are we in an uptrend or downtrend" line. Price above MA60 with MA60 rising = uptrend; price below with MA60 falling = downtrend.
Why MA60 specifically and not MA50 (US convention)? A-share retail community standardised on MA60 because it corresponds roughly to one quarter of trading days. Quarter-aligned signals matter more in a market where many investors think in quarterly accumulation / distribution cycles.
The companion signals — MA5 / MA20 / MA60 alignment (the PickSkill MA dashboard bucket logic) — capture the full trend hierarchy: MA5 > MA20 > MA60 with price above all three = "bullish alignment" (多头排列), the canonical A-share strong-uptrend pattern.
4. Volume Ratio (turnover-based, not absolute volume)
Volume Ratio = today's volume / 20-day average volume
Absolute volume is not comparable across A-share stocks (small-caps and large-caps trade at completely different absolute volumes). The ratio normalises out the scale.
Key thresholds:
- Ratio ≥ 1.5 with price up = "放量上涨" (heavy buying on a price gain) = bullish participation.
- Ratio ≥ 1.5 with price down = "放量下跌" (heavy selling) = bearish distribution.
- Ratio ≤ 0.7 = "缩量整理" (light-volume consolidation) = wait-and-see.
Better signal than US Volume: A-share retail-dominated flow makes volume more meaningful as a sentiment indicator (institutions don't dominate the tape). A 2× volume day on an A-share usually corresponds to a real shift in retail attention; the same on a US large-cap may be index-rebalance noise.
The PickSkill volume indicator renders this with a 5-day rolling sentiment, so single-day volume spikes don't dominate.
5. Capital Flow proxy — for direction confirmation
A-share retail traders look for "主力资金" (institutional / large-order flow) as a directional confirmation. The real version requires Level-2 order-book data with order-size classification. The synthetic version is:
Daily Flow = sign(close − prev_close) × volume × close
Cumulative Flow (20d) = sum of Daily Flow over last 20 trading days
This is a direction-and-magnitude estimate, not real institutional flow — see the Flow methodology note on the PickSkill dashboard, which is explicit about this. Real Level-2 flow data is expensive and lives behind paywalls (东方财富 Choice, 同花顺 iFinD). For users without those subscriptions, the synthetic proxy captures direction with reasonable accuracy.
Signal logic:
- Cumulative 20-day flow strongly positive + 5-day flow same sign = bullish inflow.
- Cumulative strongly negative + 5-day same sign = bearish outflow.
- Cumulative near zero or 5-day diverging = neutral / direction unclear.
Three indicators NOT on this list (and why)
RSI(14). Useful elsewhere, less useful on A-shares. The reason: A-share daily limits make RSI saturation a structural artifact, not a meaningful overbought signal. A stock with 4 consecutive limit-up days will print RSI near 100 because of the structural constraint, not because of organic overbought pressure. The signal mostly fails. If you want a bounded oscillator on A-shares, use KDJ instead — its extreme-zone semantics carry the meaning RSI's saturation doesn't on this market.
Bollinger Bands. Useful elsewhere, problematic on A-shares because consecutive limit days artificially compress standard deviation (limit_price - limit_price = 0 daily change, no variance contribution). Bandwidth squeezes during limit-up streaks read as "coiled spring" when they actually reflect a structural quiet period. If you must use Bollinger Bands on A-shares, read bandwidth in the context of whether the stock has been hitting limits recently.
ADX/DMI. Useful for US trend filtering, but A-share limit days compress True Range (high − low = 0 on limit days), so ADX understates trend strength during the most active periods. The PickSkill ADX dashboard marks limit days as neutral in the bucket trail, but the underlying ADX line still reflects the compressed reading.
The 5-indicator filter for A-share entries
The standard workflow for A-share retail technical setups, in order:
- MA60 trend filter — only consider stocks where price > MA60 with MA60 rising (uptrend) or the inverse for shorts.
- MACD confirmation — MACD water-below golden cross or sustained HIST expansion above zero.
- KDJ entry timing — K and D in or recently exiting the oversold zone (< 20), K crossing above D.
- Volume Ratio confirmation — ratio ≥ 1.2 on the entry day, ideally with price up.
- Capital Flow corroboration — cumulative flow positive or just turned positive.
A stock that passes all 5 filters is a high-conviction setup. A stock that passes 3 out of 5 is a candidate worth watching. Anything below 3 is signal noise.
The PickSkill summary view renders all 5 indicators side-by-side with 5-day signal trails, so the filter pass / fail status across a portfolio of A-share names is a 30-second scan, not a tab-hopping research session.
Try it now. Open the /indicators page with an A-share portfolio (e.g., 600519.SS, 000333.SZ, 300750.SZ) and look at the summary view. Names with KDJ + MACD + MA + Volume all showing green over the last 2–3 days are the candidates the filter wants to surface.
How this compares to the US-market 3-indicator filter
The 3-indicator filter for US markets is ADX + MACD + RSI. The A-share equivalent above is MA60 + MACD + KDJ + Volume + Flow. The shape is similar (regime → direction → timing → participation → confirmation), but the specific indicators differ because:
- ADX is replaced by MA60 — both serve as regime filter, but MA60 is the cultural standard on A-shares and behaves more predictably under limit-day conditions.
- RSI is replaced by KDJ — KDJ is the cultural standard and better-suited to retail-driven oscillation patterns.
- A volume / flow layer is added because retail-driven markets make those signals more informative.
Both filters share MACD as the directional trigger because MACD's math is market-neutral (works on any liquid daily-bar series).
Further reading
- Shanghai Stock Exchange — Price Limit Rules — the official source for A-share daily price-limit mechanics.
- Shenzhen Stock Exchange — ChiNext / STAR Board ±20% rules — official documentation for the extended-limit boards.
- 雪球 (Xueqiu) A-share retail community — primary venue where KDJ / MACD / MA60 vocabulary is used natively.
FAQ
Should I use these 5 indicators on Hong Kong stocks too? Mostly yes, with caveats. HK stocks don't have daily price limits, so the limit-day defenses don't fire — the indicators behave more like US stocks. Capital flow (Northbound funds for dual-listings) is genuinely tradable on HK because real data exists. KDJ works on HK retail-traded mid-caps but less well on the institutional H-share large-caps (0700.HK, 9988.HK trade more like US large-caps). For a pure A-share workflow, use the 5 above; for HK, lean toward the US 3-indicator filter plus capital flow.
What about turnover rate (换手率)? Turnover rate is highly informative on A-shares — it normalises out the float-size effect that affects absolute volume. Volume Ratio (today / 20-day average) approximates turnover-relative behaviour but is not the same metric. The PickSkill dashboards currently render Volume Ratio. A future enhancement will add turnover rate when an A-share float-size data source is wired in. For now, treat Volume Ratio as the closest available proxy.
Do I need real institutional capital flow data, or is the synthetic proxy enough? The synthetic proxy captures direction reasonably (positive when accumulation is dominating, negative when distribution). It misses the magnitude — real Level-2 large-order flow shows institutional intent in a way the synthetic version cannot. For most retail workflows, the synthetic proxy is sufficient; for serious A-share traders, the real Level-2 data via 同花顺 iFinD or 东方财富 Choice is worth the subscription cost. The PickSkill Flow indicator labels itself as a synthetic proxy explicitly to avoid pretending otherwise.
Can I use this set on cryptocurrency? Partly. KDJ and MACD work on crypto (24/7 trading, retail-dominated). MA60 works as a regime filter. Volume Ratio is useful but crypto volume is fragmented across exchanges, so the absolute number is less informative than the trend. Capital flow proxy can be computed the same way — and synthetic is often the only choice for crypto, since true institutional-flow data is sparse.
What if I want a more conservative filter (fewer signals, higher conviction)? Add ADX(14) > 25 as a gating filter on top of the 5 indicators above. ADX < 20 days are non-trending — even when the other 5 indicators line up, the trend regime may not be there to support the move. ADX > 25 days are when the 5-indicator setup has the most edge. This brings the A-share workflow back to a 6-indicator system — MA60 + MACD + KDJ + Volume + Flow + ADX filter — which is the canonical "everything turned on" view in the PickSkill summary tab.