MACD on A-Shares vs US — Same Formula, Different Signal
A-share ±10% limits and T+1 settlement feed different inputs into the same MACD formula. Four differences and how to handle them.
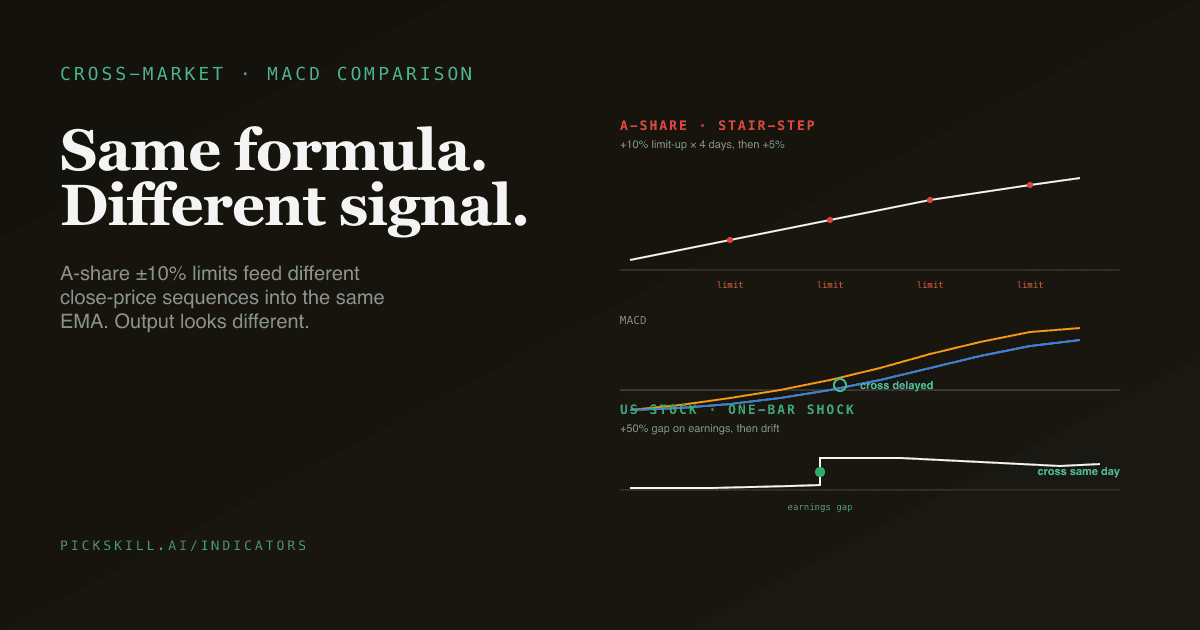
MACD's formula is identical on Chinese A-shares and US stocks: DIF = EMA(close, 12) − EMA(close, 26), DEA = EMA(DIF, 9), HIST = (DIF − DEA) × 2. But the same formula produces meaningfully different signal quality across the two markets, because A-shares have ±10% daily price limits, T+1 settlement (no day-trading), and an 80%+ retail-driven order-flow share that fundamentally change what the EMA inputs look like. This post walks through four specific differences and what they mean for using MACD on each market.
Key takeaways
- The math is universal; the inputs are not. A-share daily limits and halt fills feed degenerate data into the same EMA formula, producing structurally different MACD output.
- Golden crosses are delayed 1–2 bars on A-shares after consecutive limit-up days — read the histogram trajectory, not just the cross moment.
- A-share MACD divergence is more common but less reliable than US-market divergence, because the limit-truncated close prices create artificial price-vs-momentum gaps.
- US after-hours moves baked into the next open's gap create one-bar MACD shocks that don't exist on A-shares (no after-hours session for individual stocks).
- The PickSkill MACD dashboard detects limit-day bars and masks them as neutral in the 5-day signal trail so the bucket call doesn't read fake bullish during a limit-up streak.
Difference 1: Daily price limits compress EMA inputs
A-share daily price limits cap the daily move at ±10% (mainboard), ±20% (ChiNext, STAR Market), or ±5% (ST stocks). On a limit-up day, close = limit_price and intraday range collapses to a single point. On the next day, the new EMA input is close = previous_limit_price, then close = next_limit_price, and so on.
The effect on MACD:
| Bar | A-share (limit-up streak) | US stock (free trading) |
|---|---|---|
| Day 1 | close = +10% (limit hit) | close = +14% |
| Day 2 | close = +10% (limit hit) | close = +6% |
| Day 3 | close = +10% (limit hit) | close = −2% |
| Day 4 | close = +6% (limit released) | close = +4% |
The A-share series has lower per-bar variance during the streak; the US series has a single explosive bar followed by mean reversion. MACD on the A-share series will register a smoother, more sustained DIF rise; MACD on the US series will register a sharper, more compressed DIF spike that fades.
Implication: a "DIF rising for 4 days" signal on an A-share post-limit-up streak does not have the same edge as the same pattern on a US stock — it partly reflects the structural constraint, not pure momentum. The PickSkill dashboards detect limit-up bars (high == low on the daily) and mask the bucket trail to neutral on those days.
Difference 2: Golden crosses are delayed on A-shares after consolidation
The mechanism: during consecutive limit days, the close stair-steps in fixed-size increments rather than flowing continuously. EMAs absorb the stair-step gradually. When the stock breaks out of the limit streak (e.g., a 5-day limit-up run ending with a free-trading day), DIF accelerates but takes 1–2 additional bars to cross DEA compared to a US stock with the same total price move.
Example: a stock that goes +10%, +10%, +10%, +10%, +5% (A-share, 5 days) ends the run with a different MACD reading than a US stock that goes +50% in one day. Both have the same cumulative price change. The A-share MACD will signal the golden cross 2–3 bars into the rally; the US MACD will signal it on the breakout day itself.
Practical impact: on A-shares, "MACD golden cross + price already 30% off the bottom" is normal — the indicator is confirming a move that has been visible for a week. The signal still has value, but the entry comes later in the move than on US stocks. Combine MACD with KDJ in the oversold zone for earlier entries; KDJ catches the bottom turn before MACD does, particularly on A-shares.
Difference 3: Divergence is more common but less reliable on A-shares
Bearish divergence — price makes a new high but MACD doesn't — is a higher-frequency event on A-shares than on US stocks for two reasons:
- Limit-truncated highs create artificial price-vs-momentum gaps. When the close stair-steps via limits, the price chart shows clean new highs while the EMAs are still catching up. Visual divergence appears where no real momentum exhaustion exists.
- Retail-driven sentiment swings produce more divergence-shaped patterns generally — sudden enthusiasm pushes price faster than momentum can confirm.
Implication: a bearish divergence on an A-share stock has a lower forward win rate than the same pattern on a US stock. Treat A-share divergence as a candidate flag rather than an action signal, and require confirmation from a second indicator (KDJ death cross in overbought zone, volume distribution pattern, MA60 break) before acting.
Difference 4: US gap moves create one-bar MACD shocks
US stocks have after-hours trading, pre-market, and earnings-driven overnight gaps. A typical large-cap can move 5–15% from one close to the next without any trading in between. The next day's open absorbs the move, but the daily-bar EMA only sees the close-to-close gap as a single jump.
The effect on MACD: a one-bar +10% gap from close to close adds significantly to the fast EMA (12-period) immediately, while the slow EMA (26-period) absorbs it more gradually. DIF jumps; a golden cross can occur in a single bar on a single news event.
A-shares don't have after-hours trading for individual equities (the closest equivalent is the next morning's opening auction, which is more bounded). So the same +10% catalyst on an A-share spreads across consecutive limit-up days rather than concentrating in a single bar. The MACD pattern reads as a sustained build, not a one-bar event.
Implication for cross-market analysts: a MACD signal on a US stock that triggered on earnings day has different meaning than the same pattern on an A-share — the US version is a single-event signal, the A-share version is a multi-day buildup. Don't conflate them in cross-market analysis.
How the PickSkill dashboards handle the differences
The same MACD formula runs across all markets in the /indicators dashboards — no market-specific math forks. Instead, the structural differences are handled at the bucket layer:
- Limit-day detection: every bar with
high == low(A-share limit-up/limit-down/halt) is detected. The bucket for that day is forced to neutral in the 5-day signal trail. This prevents a fake "bullish" call during a consecutive-limit run. - 5-day trail context: the trail makes the cross-market behaviour visible. An A-share MACD that just turned bullish after a multi-bar limit-up streak shows up as
neutral neutral neutral neutral bullish— the trail reveals the limit-days context. The same pattern on a US stock with a single earnings gap shows asneutral neutral neutral neutral bullish— same visual, but a different underlying story. The user can hover the chart to disambiguate. - Color convention auto-swap: A-share users see red histogram bars above zero (Chinese red-up convention); US users see green above zero. The signal is the same; the visual matches the user's market.
When to use MACD on each market
| Use case | A-share signal quality | US signal quality |
|---|---|---|
| Spotting trend regime changes (multi-week) | High (slow but reliable) | High |
| Catching short-term swing entries | Medium (1–2 bar lag) | High |
| Reading divergence | Low (high false-positive rate) | Medium |
| Confirming earnings-driven moves | N/A | High (gap-driven, single-bar) |
| Filtering out range-bound noise | Medium | High (works well with ADX) |
For A-share workflows, MACD is one input alongside MA60 and KDJ — see The Best 5 Technical Indicators for A-Shares. For US workflows, MACD is the directional trigger in the standard 3-indicator filter.
See it side-by-side. Open the /indicators page with a mix of A-share names (600519.SS, 300750.SZ) and US names (NVDA, AAPL). Switch to the MACD tab. The same indicator behaves visibly differently across the two markets — the trail and bucket call expose the difference in real time.
Further reading
- Shanghai Stock Exchange — Trading Rules — official source for A-share daily limits and T+1 settlement mechanics.
- SEC Investor.gov — How Markets Work — US trading-hours and gap mechanics that affect MACD on US stocks.
FAQ
Should I use different MACD parameters on A-shares?
No. The (12, 26, 9) defaults work on A-shares. Changing the parameters won't fix the limit-day structural issues; only the limit-day handling at the bucket layer fixes those. The PickSkill dashboards use defaults across all markets for comparability.
Why does MACD seem to "work better" on A-shares according to some Chinese trading guides? Because A-share retail markets oscillate more cyclically (retail-flow-driven), and MACD is a momentum indicator — it picks up the cyclical pattern. Combined with the cultural standardisation on MACD as one of the first indicators taught in A-share retail education, MACD is over-used relative to its actual edge. The honest answer: MACD works on A-shares with the same caveats it has on US stocks — combine with a trend filter (MA60 / ADX) and a second oscillator.
What about MACD on Hong Kong stocks? HK stocks don't have daily price limits, so the limit-day issues don't apply — MACD behaves more like it does on US stocks. The HK market is also more institutionally driven than A-shares, less than US, so MACD signal quality sits in between. For HK names like 0700.HK or 9988.HK, the US-style 3-indicator filter (MACD + ADX + RSI) generally works.
Does T+1 settlement affect MACD? Not directly. MACD is computed from daily closes; T+1 is about settlement, not the EOD close-print. The indirect effect: T+1 means retail traders cannot exit a same-day position, so end-of-day flow is more "settled" — slightly cleaner close prints than the noisy late-day reversal flows you see on US stocks. The signal-quality benefit is small but real.
Is the limit-day defense unique to PickSkill? We are not aware of another retail-grade indicator platform that explicitly detects A-share limit bars and forces the bucket to neutral. East Money and Tonghuashun compute MACD on limit-up close prices (technically correct but conceptually misleading); TradingView treats A-shares the same as US stocks (no limit-day awareness). PickSkill's 5-day signal trail implementation flags this explicitly so users see "no information available on this bar" rather than a confident-looking false call.