What Is ADX? The Indicator That Tells You When Not to Trade
ADX is a 14-period Wilder measure of trend strength, paired with DI+ and DI−. Formula, why ADX < 20 means stay out, and the 3-indicator filter.
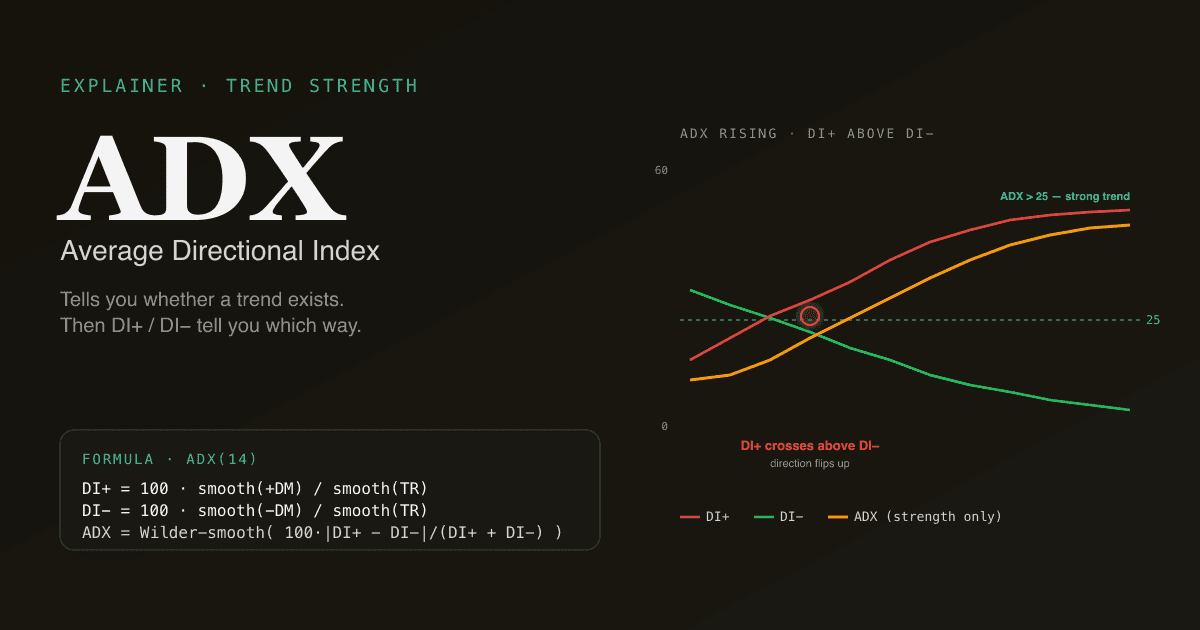
ADX (Average Directional Index) is a 14-period Wilder-smoothed measure of trend strength on a 0–100 scale. It is paired with DI+ and DI− — the positive and negative directional indicators — which together identify trend direction. ADX answers the question almost no other indicator answers: is there a trend at all? A high ADX with rising DI+ means a strong uptrend; the same ADX with rising DI− means a strong downtrend; a low ADX means no trend — and that is when most other indicators (MACD, RSI, KDJ) give their worst signals.
Key takeaways
- Three lines: DI+ (positive directional movement), DI− (negative directional movement), and ADX (the smoothed magnitude of
|DI+ − DI−|). - ADX is non-directional. It measures the strength of a trend, not its direction. Direction comes from comparing DI+ and DI−.
- ADX > 25: a real trend exists. ADX < 20: range-bound; sit it out, mean-reversion regime.
- DI+ above DI− = uptrend; DI− above DI+ = downtrend. The crossover is a directional event.
- The single most useful filter for combining other indicators — see Combining MACD, RSI, and ADX.
How is ADX calculated?
ADX is mechanically more involved than RSI or MACD, but the logic is straightforward.
Step 1 — Compute the True Range (TR) for each bar:
TR = max( high − low, |high − prev_close|, |low − prev_close| )
This captures the actual price movement including overnight gaps.
Step 2 — Compute directional movement +DM and −DM:
+DM = high − prev_highif that quantity exceeds bothprev_low − lowand 0; else 0.−DM = prev_low − lowif that quantity exceeds bothhigh − prev_highand 0; else 0.
Only one of +DM and −DM is non-zero per bar.
Step 3 — Wilder-smooth TR, +DM, −DM over 14 bars (a recursive prev − prev/14 + cur rolling sum):
| Quantity | Wilder smoothing |
|---|---|
| Smoothed TR | smoothed_TR_n = smoothed_TR_(n−1) − smoothed_TR_(n−1)/14 + TR_n |
| Smoothed +DM | (same formula, with +DM) |
| Smoothed −DM | (same formula, with −DM) |
Step 4 — Compute DI+ and DI−:
| Indicator | Formula |
|---|---|
| DI+ | 100 × smoothed_+DM / smoothed_TR |
| DI− | 100 × smoothed_−DM / smoothed_TR |
| DX | `100 × |
Step 5 — Compute ADX as a 14-bar Wilder-smoothed average of DX, seeded with a simple average of the first 14 DX values.
The whole sequence runs in O(n) on a series of n bars, with no lookback past 28 bars in practice.
What does an ADX reading actually mean?
The conventional Wilder thresholds:
| ADX | Trend regime |
|---|---|
| 0–20 | No real trend — range-bound, sideways |
| 20–25 | Trend forming or weak |
| 25–40 | Strong trend |
| 40–60 | Very strong trend |
| 60–100 | Extreme trend (rare) |
ADX above 25 is the practical "a trend exists" threshold. Below 20, the market is grinding sideways with no directional persistence — even if MACD is showing a golden cross or RSI is signalling oversold, those signals have less reliability in a non-trending regime, because there is no trend for the momentum cross or the mean-reversion to attach to.
The single highest-leverage use of ADX is as a gating filter on other indicators: only trust momentum signals (MACD, RSI breakouts) when ADX confirms a trend is in place. This is also why ADX is the most-undervalued indicator in retail technical-analysis — it tells you when not to trade, which is the harder discipline.
What do DI+ and DI− tell you?
DI+ and DI− separate the direction of the trend ADX is measuring. Their values are themselves percentages of TR (the daily range), so they share a comparable scale.
- DI+ above DI−: the trend (whatever its strength according to ADX) is upward.
- DI− above DI+: the trend is downward.
- DI+ crossing above DI−: a directional flip from down to up.
- DI− crossing above DI+: a directional flip from up to down.
Combining ADX and the DI relationship produces the practical bucket logic used in the PickSkill ADX dashboard:
| Condition | Bucket |
|---|---|
| ADX > 25 and DI+ > DI− | Bullish — strong uptrend |
| ADX > 25 and DI− > DI+ | Bearish — strong downtrend |
| ADX < 20 | Neutral — no trend, stay out |
| 20 ≤ ADX ≤ 25 | Neutral — trend forming / unclear |
Why is "no trend" a useful signal?
This is the contrarian truth in technical analysis. Most indicators only generate directional signals — buy this, sell that. ADX is the rare indicator that legitimately says "do nothing." That recommendation is more valuable than it sounds.
The honest count: in any given quarter, equity markets spend roughly 40–60% of trading days in non-trending regimes (ADX below 20). During those days, trend-following strategies whipsaw; momentum signals generate false starts; mean-reversion can work but the win-rate edge is narrower than in regime extremes. A trader who suspends position-taking when ADX is below 20 — and waits for trending markets — historically outperforms a trader who takes every signal across all regimes, even if their per-trade edge is identical.
This is also why ADX makes MACD and KDJ better. Their golden / death crosses produce many false signals in non-trending regimes; ADX as a filter eliminates ~50% of those false signals at the cost of a small number of missed real signals.
How does ADX behave in different markets?
US equities: ADX works as designed. Large-cap stocks trend cleanly; ADX accurately reflects trend strength. Earnings-day gaps can produce sudden ADX spikes that aren't really sustained trend — be cautious in the 5 trading days post-earnings.
Hong Kong stocks: similar to US. Lower liquidity on small-caps can produce erratic ADX. Stick to ADX on the H-shares of large-caps (0700.HK, 9988.HK).
Chinese A-shares: the ±10% (or ±20%, ±5%) daily limits compress True Range on limit-up / limit-down days — TR collapses, ADX may temporarily understate trend strength. The PickSkill dashboards handle this by marking limit-up / limit-down days as neutral in the bucket trail, but the ADX line itself reflects the (artificially) compressed reading on those days. Read trend confirmation across the whole 5-day trail rather than relying on a single bar.
Three pitfalls with ADX
- Treating ADX as directional. ADX has no direction. A high ADX without checking DI+ vs DI− does not tell you whether the trend is up or down. Always pair ADX with the DI lines.
- Reacting to short-term ADX spikes. ADX can spike on a single very wide-range bar (earnings, news, gap) without indicating a sustainable trend. Look for ADX above 25 sustained for at least 3 consecutive bars before treating it as a real trend signal.
- Using ADX in isolation as an entry trigger. ADX is a filter, not a trigger. It says "the regime is right for momentum trades" — you still need a momentum signal (MACD, RSI breakout, MA cross) to time the entry. ADX > 25 without any directional signal is not actionable.
How to combine ADX with MACD and RSI
A robust three-indicator filter:
- ADX > 25 — confirms a trend exists.
- DI+ > DI− (or DI− > DI+) — confirms direction.
- MACD or RSI provides the entry trigger in the direction ADX/DMI confirmed.
In practice:
- Long entry: ADX > 25 + DI+ > DI− + MACD golden cross with rising HIST → high-conviction long.
- Short / exit long: ADX > 25 + DI− crosses above DI+ + MACD death cross → high-conviction directional flip.
- Stay out: ADX < 20 → no positions added, existing positions held only on fundamental thesis.
This pattern is the foundation of trend-following systems used across professional CTAs and retail trading systems alike. See Combining MACD, RSI, and ADX for the full workflow.
See it on your portfolio. The /indicators page renders ADX/DMI for every holding with DI+, DI−, ADX, and a 5-day bucket trail.
Further reading
- J. Welles Wilder's New Concepts in Technical Trading Systems (1978) — the original 1978 publication that introduced ADX, DI+, and DI−.
- ADX on Investopedia — modern reference covering the 25 threshold and combined-indicator workflows.
FAQ
What is a good ADX value for trading? Above 25 — that is the conventional threshold for "a real trend exists." Above 40 is even better (very strong trend). Below 20, the market is range-bound and trend-following strategies will whipsaw. The 25/20 thresholds are Wilder's originals and remain the industry standard.
Does ADX tell you when to buy or sell? No. ADX tells you whether the market is trending (high ADX) or ranging (low ADX). DI+ vs DI− tells you which way the trend points. You still need a directional momentum signal (MACD cross, MA crossover, RSI bounce) to trigger an actual entry. ADX is the regime filter, not the entry trigger.
Why is ADX always positive?
By construction: DX = 100 × |DI+ − DI−| / (DI+ + DI−) uses absolute value, so DX is always 0–100. ADX is a smoothed average of DX, also always 0–100. The directional information lives in DI+ and DI−, not in ADX itself.
Does ADX work on weekly or intraday charts? Yes. Weekly ADX is slower and more reliable for swing trading; intraday ADX (1-hour, 30-minute) is faster but noisier. The 14-period default works on any timeframe; the conventional thresholds (25 / 20) apply across timeframes. The PickSkill dashboards currently render ADX on daily bars.
What is the difference between ADX and ADXR? ADXR (Average Directional Movement Rating) is the average of today's ADX and ADX from 14 bars ago. It is a slower, more smoothed version of ADX. Some Wilder originalists still use ADXR; modern practice has settled on plain ADX. The PickSkill dashboards use ADX, not ADXR.