Deep financial research,
on demand.
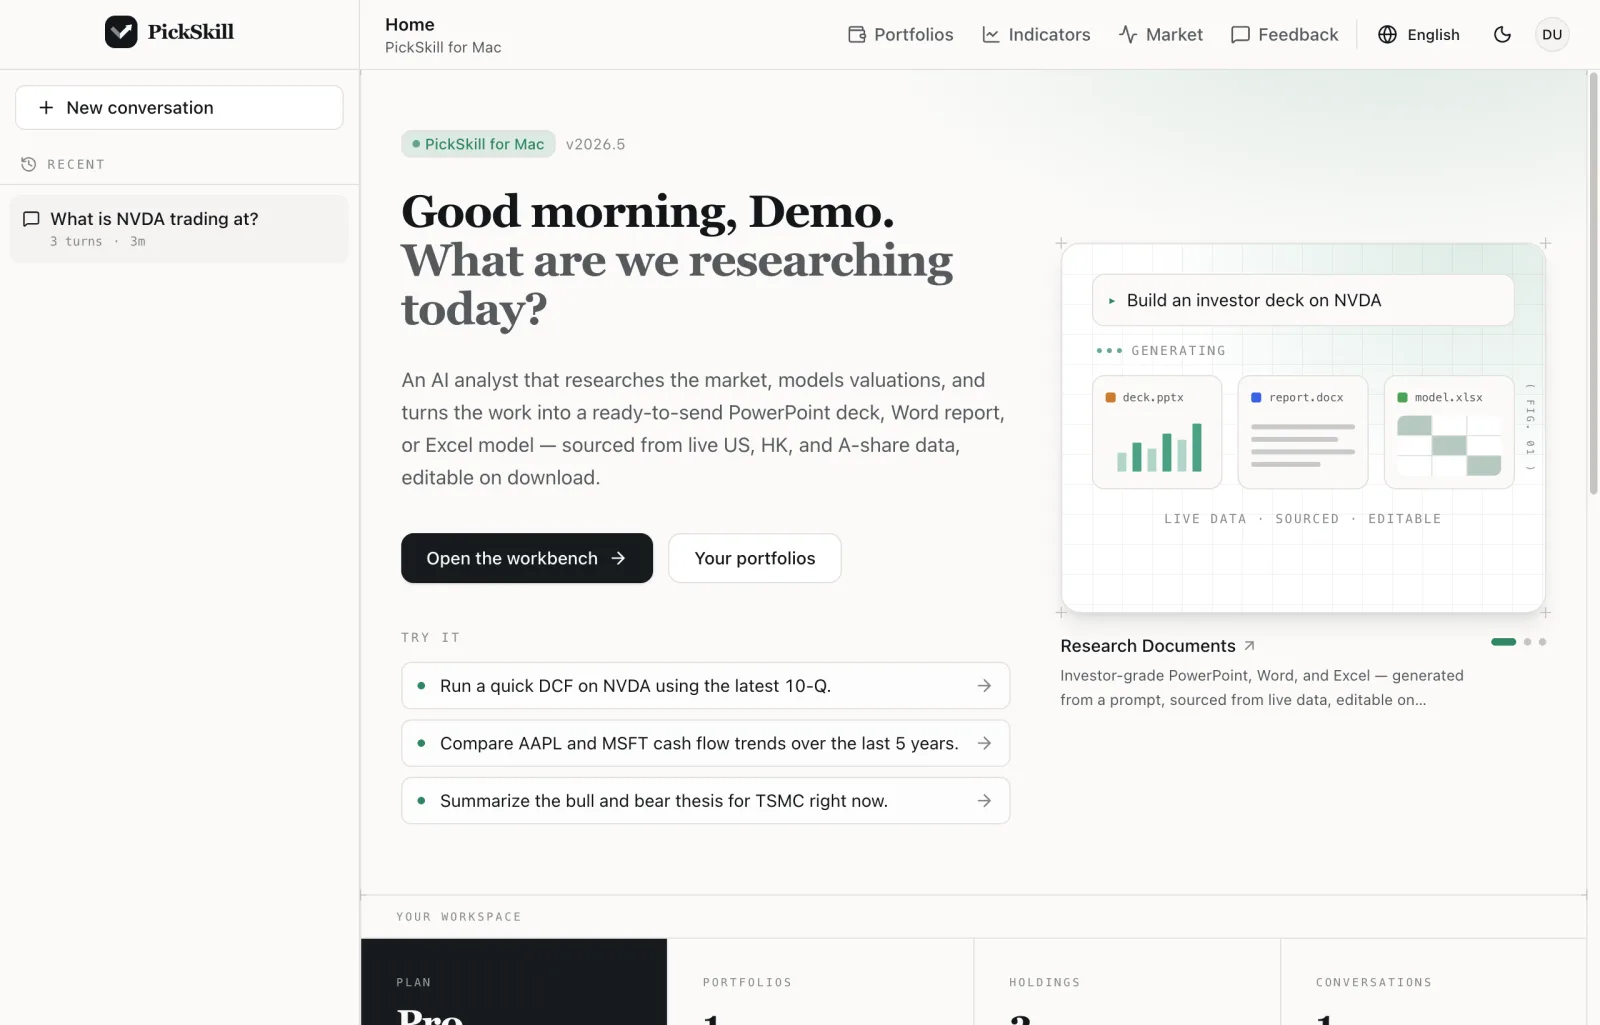
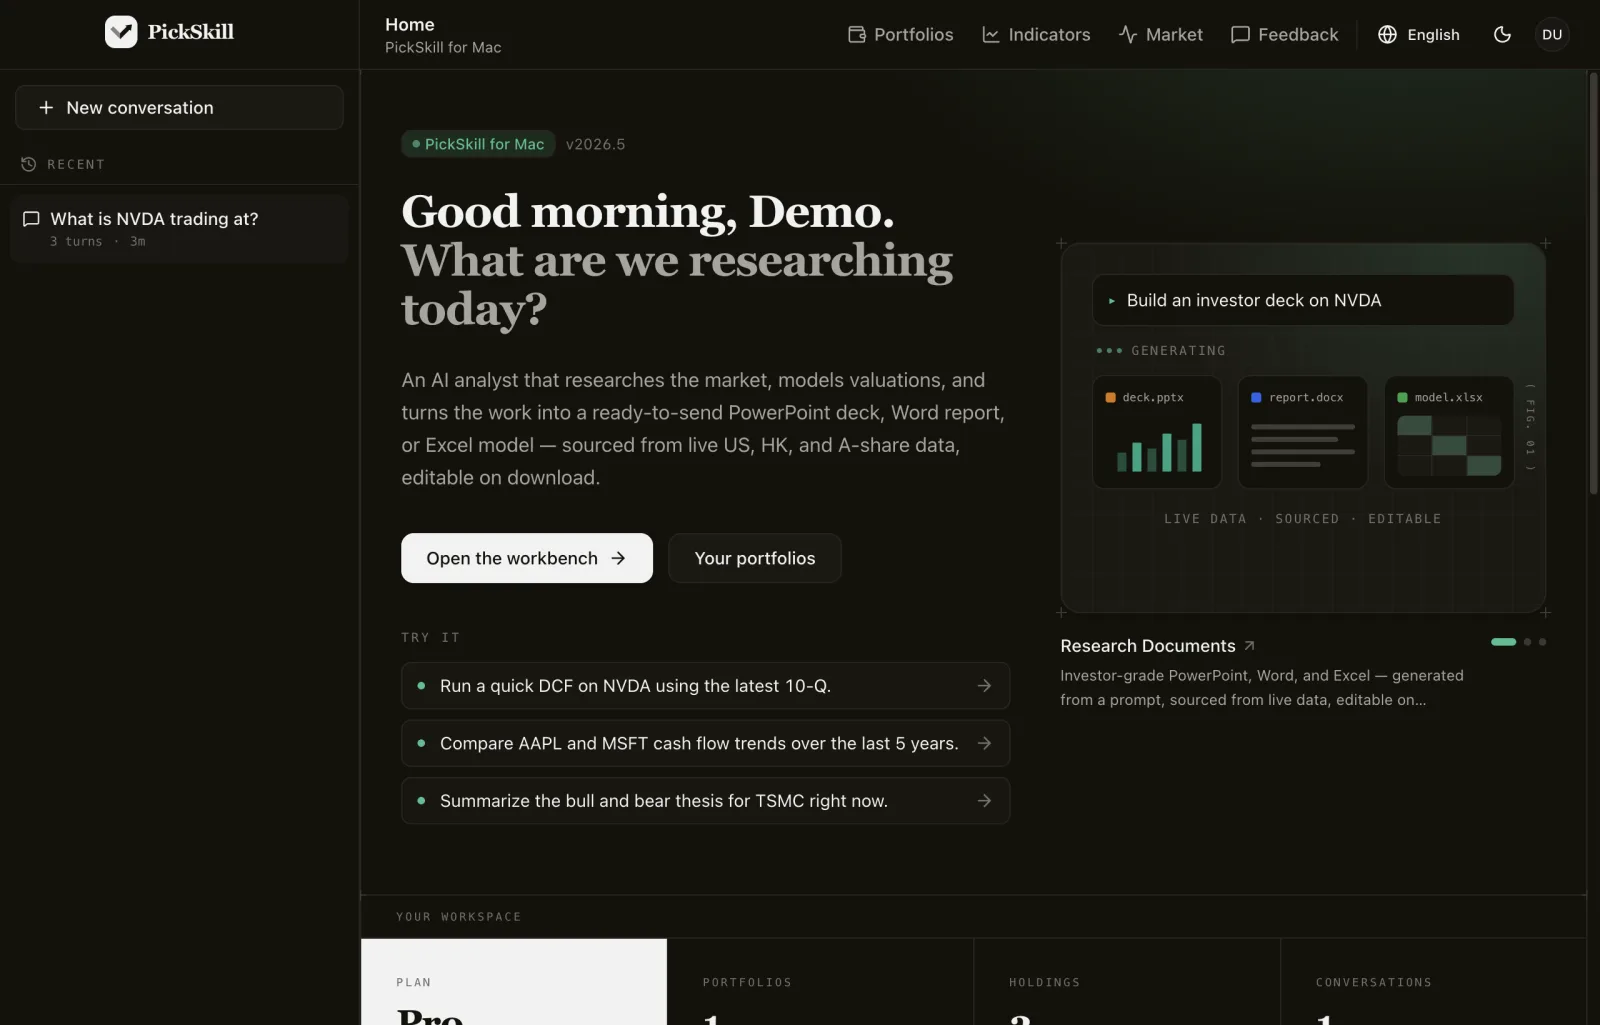
An AI analyst that researches the market, models valuations, and turns the work into a ready-to-send PowerPoint deck, Word report, or Excel model — sourced from live US, HK, and A-share data, editable on download.
Live data · PPT / Word / Excel · Sourced answers
macOSAlso on MacSignal engine
8
indicator dimensions per holding
Noise filter
5-day
signal trail behind every call
Coverage
3
markets — US · HK · A-shares
Document factory
3
native formats — PPT · Word · Excel
What it does
Research, model, and ship the deliverable.
Three things PickSkill does end to end — from the first question to a file you can send.
Analysis
Portfolio Indicators
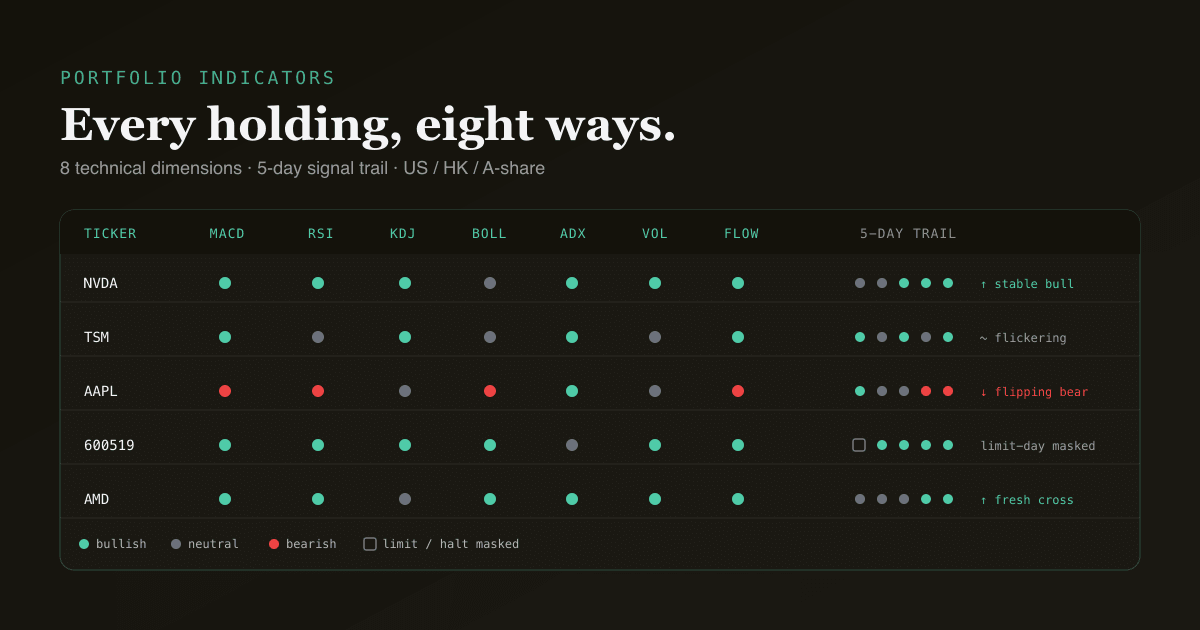
Eight technical lenses on every holding — with a 5-day signal trail that filters single-bar noise.
- Eight indicator dimensions. MACD, moving averages (20/60/200), RSI, KDJ, Bollinger Bands, ADX, volume, and capital flow — computed on the latest close for each holding, with divergence and support/resistance scans on top.
- The 5-day signal trail. Every dimension ships a 5-day bucket trail so you see whether a bullish call is stable, flipping, or flickering — not a single noisy bar masquerading as a signal.
- Built for US, HK and A-shares. Limit-up / limit-down / halt bars are detected and masked as neutral, so a string of ±10% limit days never fakes a strong-trend bucket. The same math, market-aware.
Output
Research Documents
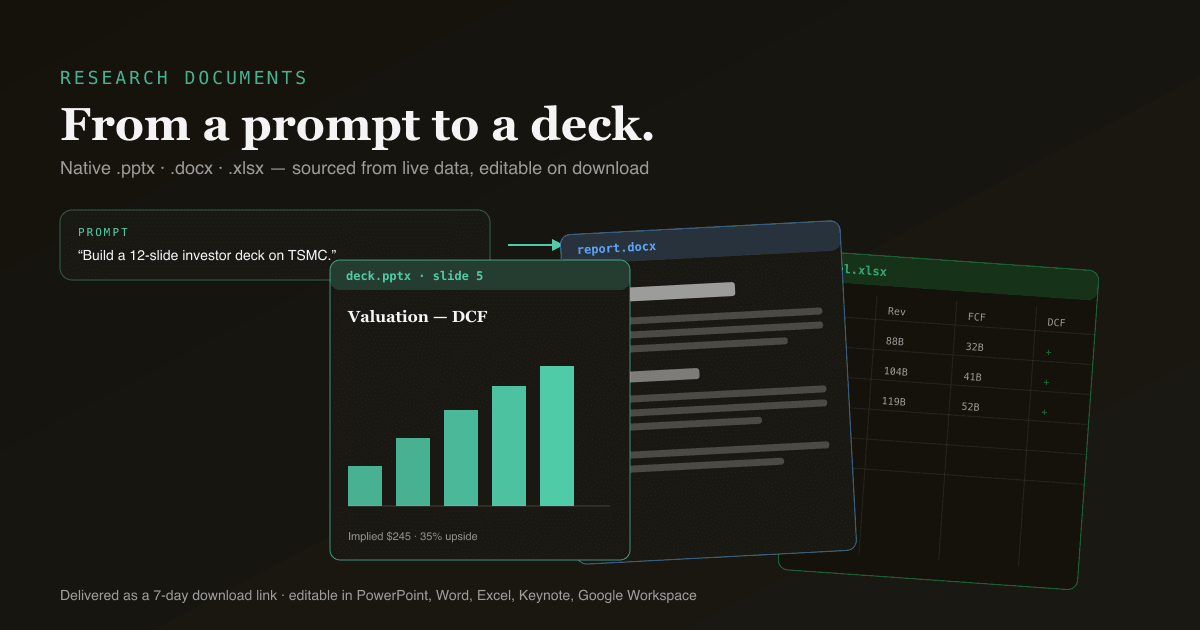
Investor-grade PowerPoint, Word, and Excel — generated from a prompt, sourced from live data, editable on download.
- PowerPoint, Word, and Excel. Native .pptx / .docx / .xlsx — not screenshots, not PDFs. Open in PowerPoint, Keynote, Word, Google Docs, Excel, or Sheets and edit every slide, paragraph, and cell.
- Sourced from live data. Charts and tables are built from the most recent SEC filings, market feeds, and computed indicators — not the model’s memory. Every number traces to a source.
- Investor-deck conventions. Decks follow the structure analysts actually present: thesis on slide 2, valuation explicit, risks pre-mortem’d. Excel workbooks ship multi-sheet with real cross-sheet formulas.
Research
AI Analyst
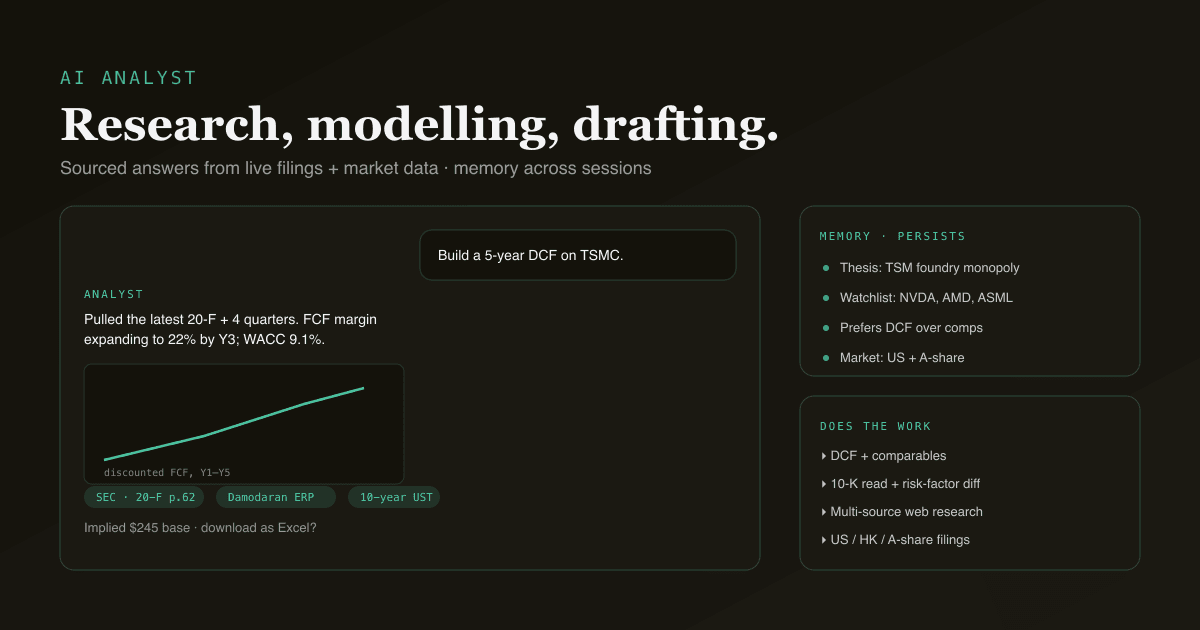
Ask anything you’d ask a junior analyst — get sourced answers and live models.
- Valuation on demand. Full discounted-cash-flow models with sensitivity tables, comparable-company analysis, and reverse DCFs — sourced inputs, editable assumptions, in seconds.
- Reads filings for you. Summarises a 10-K in 60 seconds, diffs Risk Factors year-over-year, surfaces MD&A signal and footnotes to chase — every claim linked to the page on EDGAR.
- Multi-source research. Pulls web, filings, and market data in one turn, then answers with citations — not a confident guess. Honest about what it can and can’t verify.
Desktop app
Your analyst, now a Mac app.
The whole workbench in its own window: the same account, plan and portfolios as the web, with the research agent running on your Mac.
- Its own window. Lives in your Dock and stays signed in between launches, so the workbench is one click away.
- Agent runs locally. Conversations are stored on your Mac. Live market data and models come through your PickSkill account.
- One account. Sign in with an email code or Google. Your plan, quota and portfolios carry over from the web.
Apple Silicon · M1 or later · Version 0.1.1 · macOS 13 or later · Free
FAQ
Questions, answered.
- What is PickSkill?
- PickSkill is an AI equity-research analyst. You ask a question in plain English — about a stock, a filing, a valuation, or your portfolio — and it researches live market data, runs the analysis, and can turn the result into a PowerPoint deck, Word report, or Excel model you can download and edit. It covers US, Hong Kong, and China A-share markets.
- Can PickSkill generate PowerPoint, Word, and Excel files?
- Yes. PickSkill generates native .pptx decks, .docx reports, and .xlsx models — not screenshots or PDFs. Ask for "a 12-slide investor deck on NVDA" or "a 5-year DCF in Excel" and it builds the file from live filings and market data, sourced and editable. Files are delivered as a download link in chat and open in PowerPoint, Word, Excel, Keynote, Google Workspace, or LibreOffice.
- What markets and data does PickSkill use?
- PickSkill pulls live prices, fundamentals, and SEC filings (plus HKEx and Cninfo disclosures for Hong Kong and A-shares), then computes technical indicators on the latest close. Every number traces to a source at query time, so the analysis reflects current data rather than a model's training cutoff.
- How is PickSkill different from using ChatGPT for stock research?
- A general chatbot answers from training data and often invents financial figures. PickSkill grounds every answer in live data — it pulls the actual 10-K, computes the DCF, runs the indicators, and cites its sources. It also produces real Office files instead of plain text.
- What technical indicators and portfolio tools does it include?
- All plans include eight technical dimensions — MACD, moving averages (20/60/200), RSI, KDJ, Bollinger Bands, ADX, volume, and a capital-flow proxy — plus divergence and support/resistance scans, each with a 5-day signal trail. You can track multiple portfolios and export the dashboard to a deck, report, or workbook.
- Is PickSkill free, and is it investment advice?
- There is a free plan with 30 conversations a month, no card required; paid plans start at $15/month. PickSkill is a research tool, not a licensed advisor — its output is for information and education only and is not investment advice. Always do your own due diligence.