Analysis
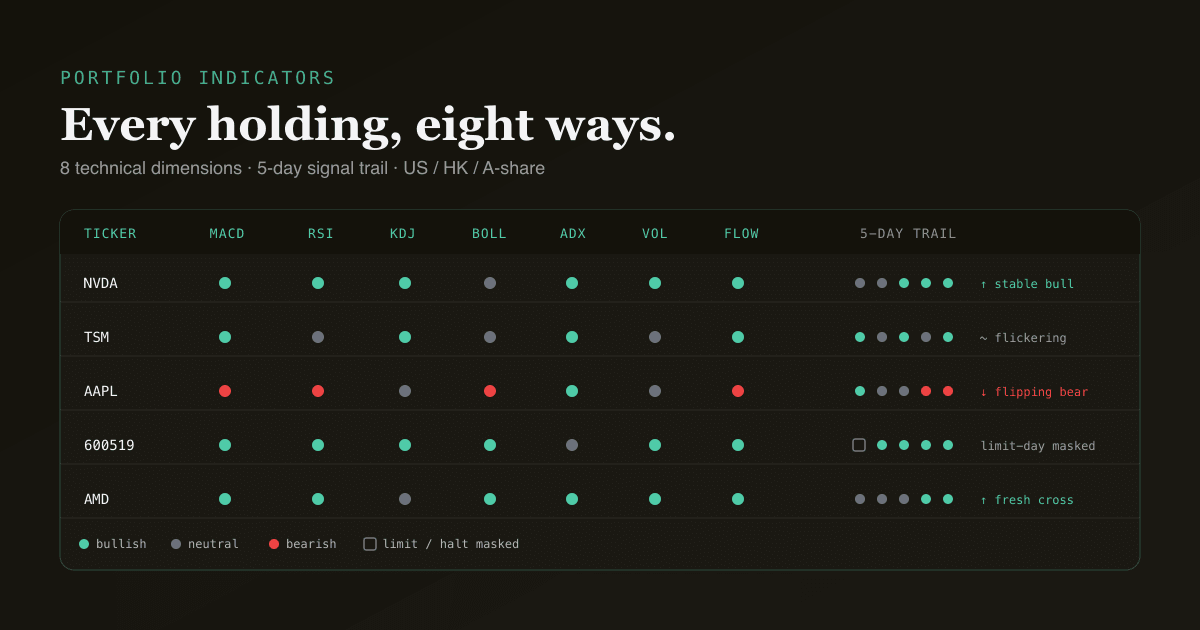
Every holding, eight ways — at a glance.
Eight technical lenses on every holding — with a 5-day signal trail that filters single-bar noise.
What it does
Eight indicator dimensions
MACD, moving averages (20/60/200), RSI, KDJ, Bollinger Bands, ADX, volume, and capital flow — computed on the latest close for each holding, with divergence and support/resistance scans on top.
The 5-day signal trail
Every dimension ships a 5-day bucket trail so you see whether a bullish call is stable, flipping, or flickering — not a single noisy bar masquerading as a signal.
Built for US, HK and A-shares
Limit-up / limit-down / halt bars are detected and masked as neutral, so a string of ±10% limit days never fakes a strong-trend bucket. The same math, market-aware.
Cross-indicator at a glance
Hover any holding to line up every dimension at once. The disciplined multi-signal read — trend filter + momentum trigger + participation — in one scan instead of eight tabs.
Export to chat, then to a deck
Send the dashboard view into a chat and turn it into a PowerPoint, Word, or Excel in one click — the indicator read becomes a shareable artefact.
How it works
- 01
Add your holdings
Build a portfolio of US, HK, or A-share tickers, added by symbol.
- 02
Read the signals + trail
Open the indicators dashboard. Every holding shows all 8 dimensions plus the 5-day bucket trail.
- 03
Filter with the multi-signal view
Use ADX as the regime filter, MACD/RSI/KDJ as triggers, volume + flow as confirmation.
- 04
Export to a deck
Turn the read into a PowerPoint, Word, or Excel for a second opinion or a client.
Frequently asked questions
- Which indicators are included?
- All eight dimensions on every plan: MACD, moving averages (20/60/200), RSI(14), KDJ(9,3,3), Bollinger Bands(20,2), ADX/DMI(14), volume/price relationship, and a capital-flow proxy — plus divergence and support/resistance scans. Any new dimension we add is included for everyone.
- What is the 5-day signal trail?
- For each indicator, the bucket call (bullish / neutral / bearish) is recomputed for the last 5 trading days and shown as a trail. A signal that holds for 5 days is very different from one that flips daily — the trail makes that visible and filters single-bar noise.
- Does it work on Chinese A-shares?
- Yes. The dashboards detect A-share limit-up / limit-down / halt bars (high == low) and mask them as neutral, so degenerate bars never produce false-positive buckets. KDJ is surfaced as the primary oscillator on A-share names per local convention.
Every holding, eight ways — at a glance.
Free to try — 30 conversations a month, no card required.