PickSkill · Blog
Notes from the desk of an AI analyst.
Stock theses, valuation explainers, and analyst how-tos from the team building PickSkill. No fluff, no recycled press releases.
 Build in publicJun 9, 2026 · 7 min
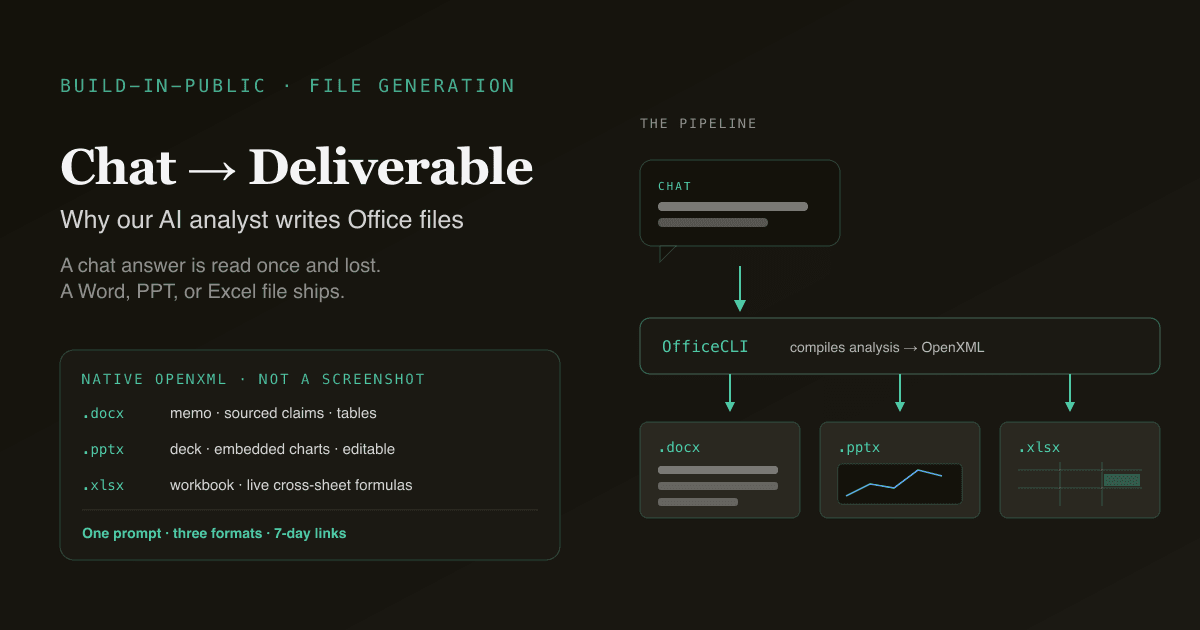
Why Our AI Analyst Writes Word, PowerPoint, and Excel
Chat answers don't ship. We taught PickSkill to generate native Word, PPT, and Excel files so research becomes a deliverable you can send and present.
Read post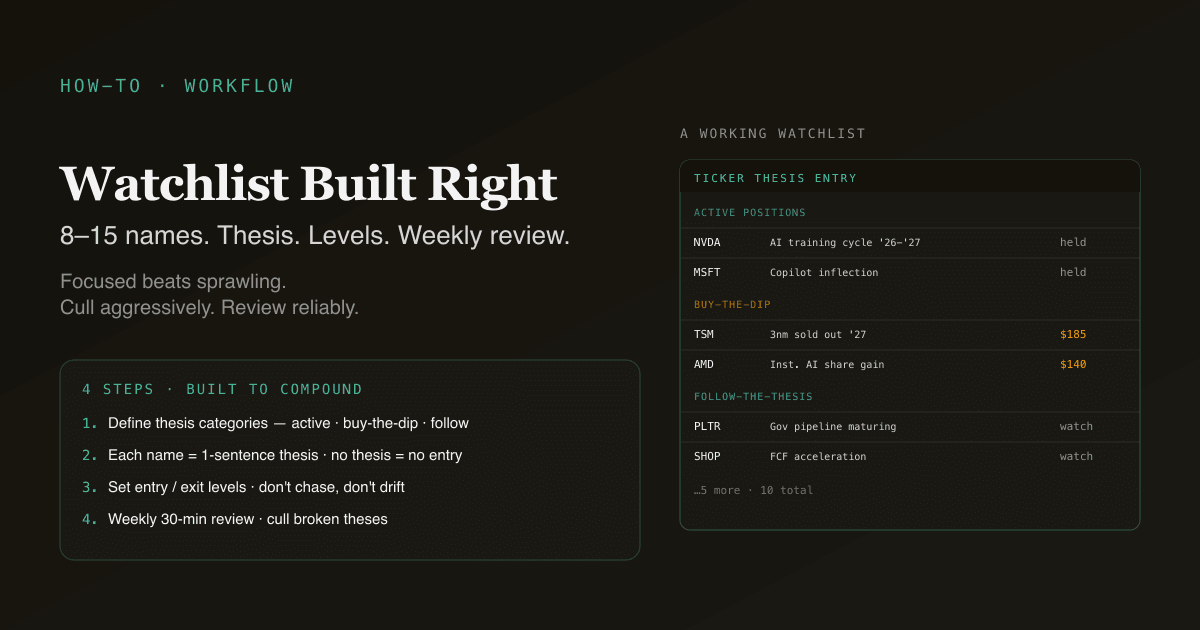 How-toMay 26, 2026 · 8 min
How to Build a Watchlist That Actually Works (Not a Dumping Ground)
A focused 8–15 name watchlist with thesis, levels, and review cadence beats a 50-name dumping ground every time. Step-by-step setup in PickSkill.
Read post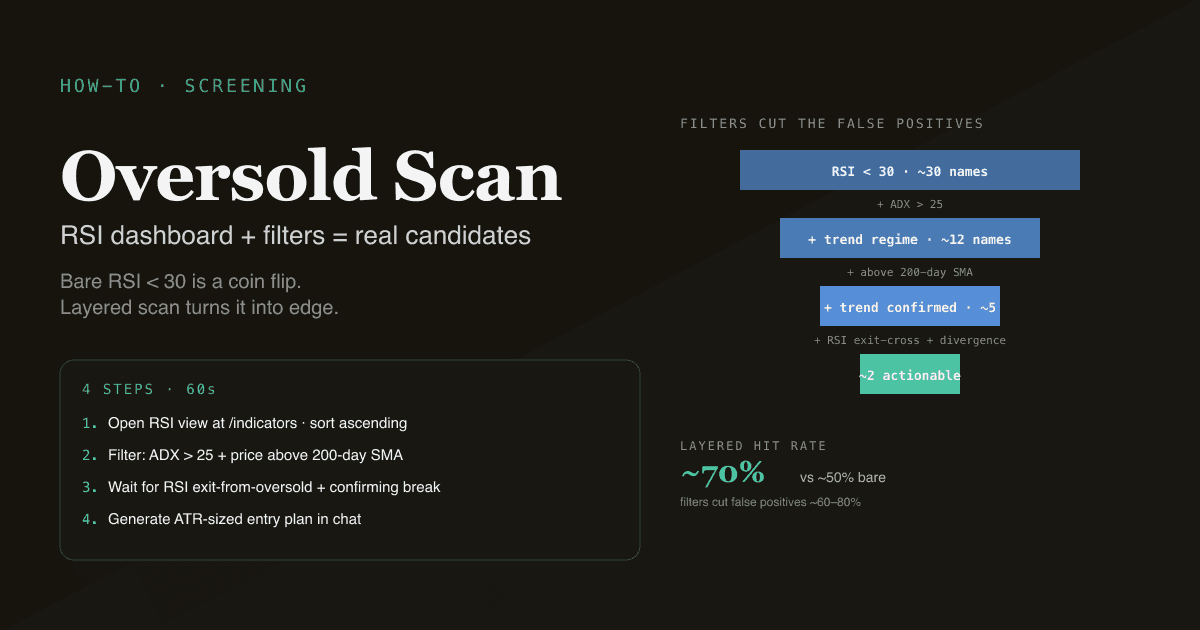 How-toMay 26, 2026 · 9 min
How to Find Oversold Stocks in 60 Seconds with PickSkill
Use the RSI dashboard to scan a portfolio or watchlist for oversold opportunities, filter for trend regime, and turn candidates into ranked entries.
Read post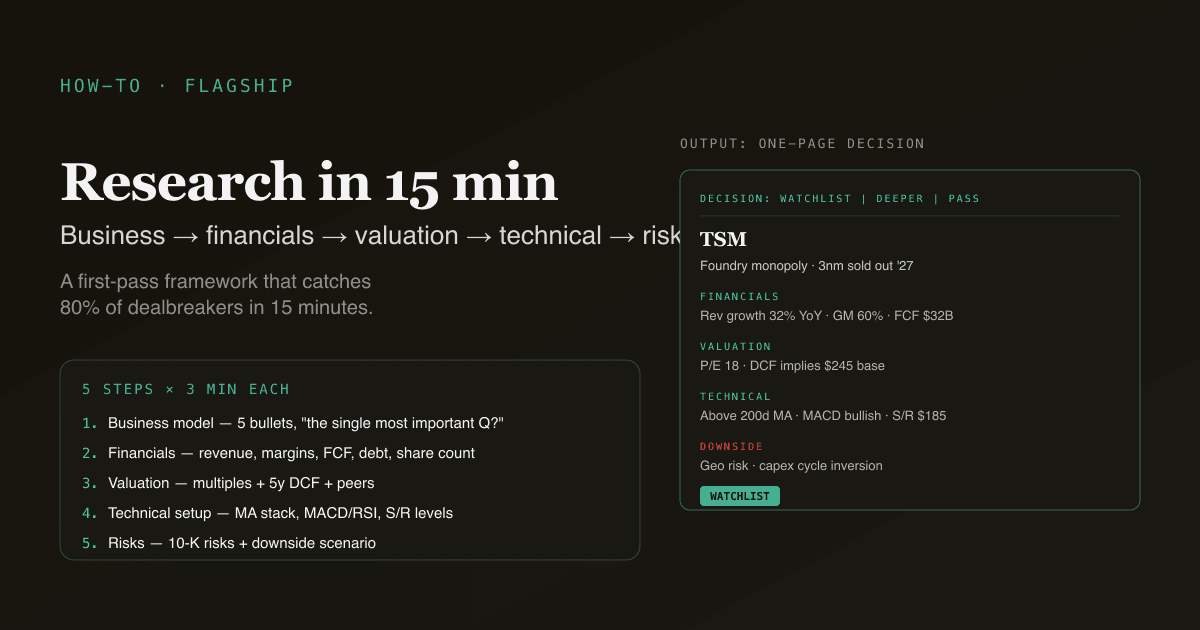 How-toMay 26, 2026 · 10 min
How to Research a New Stock in 15 Minutes with PickSkill
A complete first-pass stock research workflow — business model, financials, valuation, technical setup, and risks — in 15 minutes with the chat and indicator tools.
Read post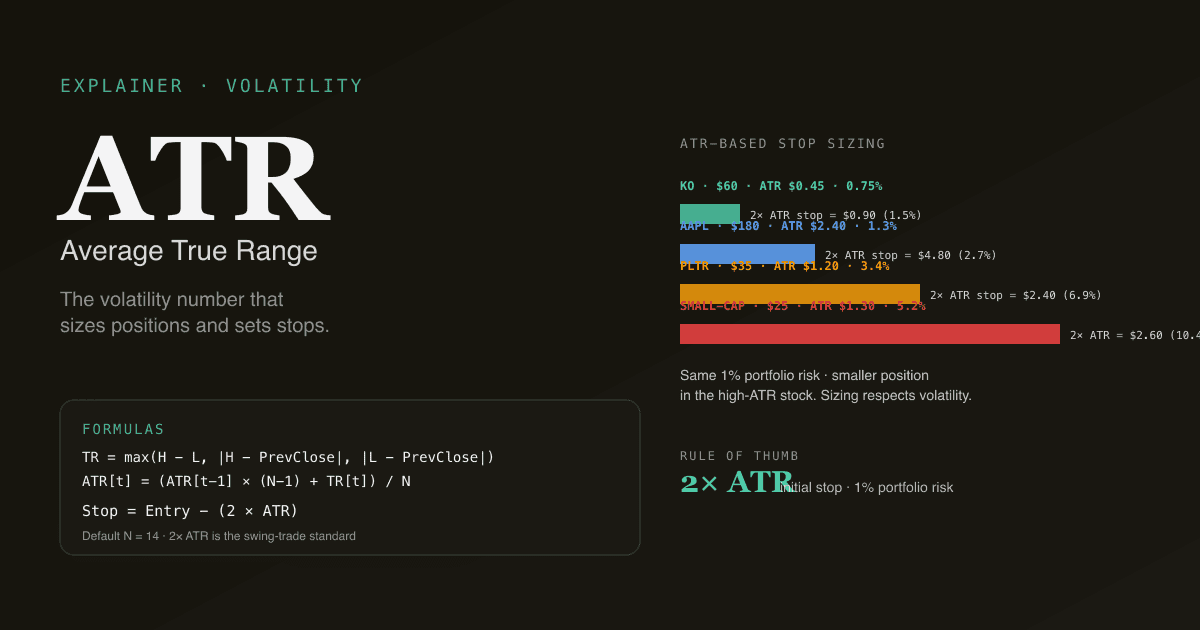 ExplainerMay 26, 2026 · 10 min
What Is ATR (Average True Range)? The Volatility Number That Sizes Positions
ATR measures average per-bar volatility. Formula, why it's the right tool for position sizing and stops, the ATR-multiple framework, and four pitfalls.
Read post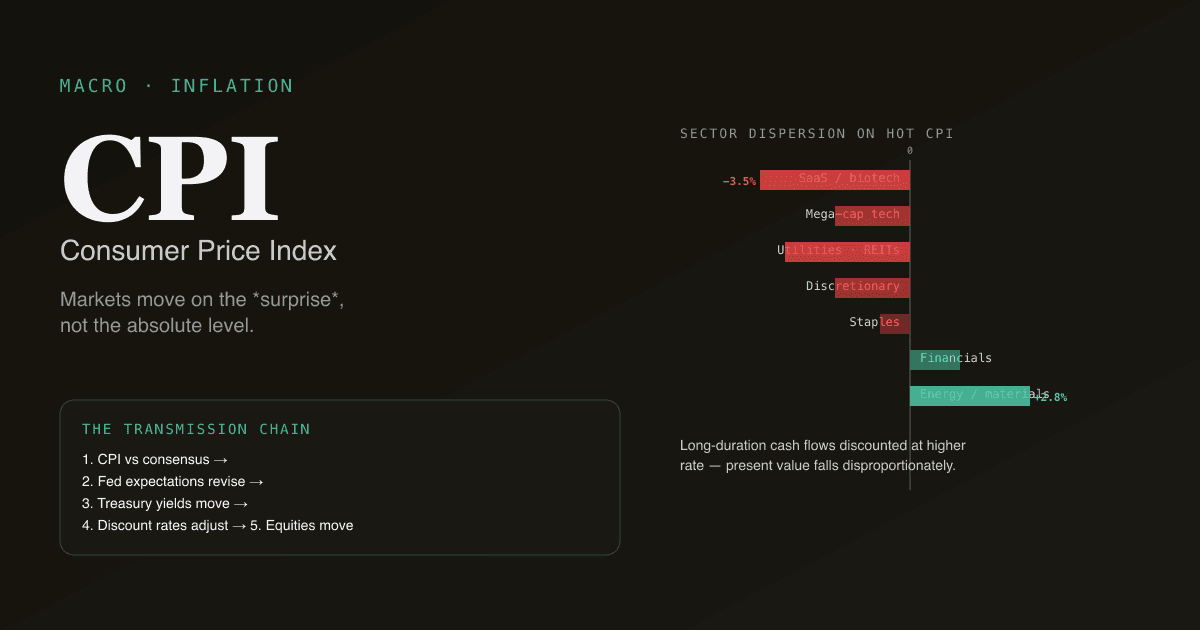 MacroMay 26, 2026 · 10 min
What Is CPI — and How Does It Actually Affect Stocks?
CPI measures inflation. Formula, the headline vs core distinction, why "above/in-line/below consensus" moves markets, and the sectors that win and lose each scenario.
Read post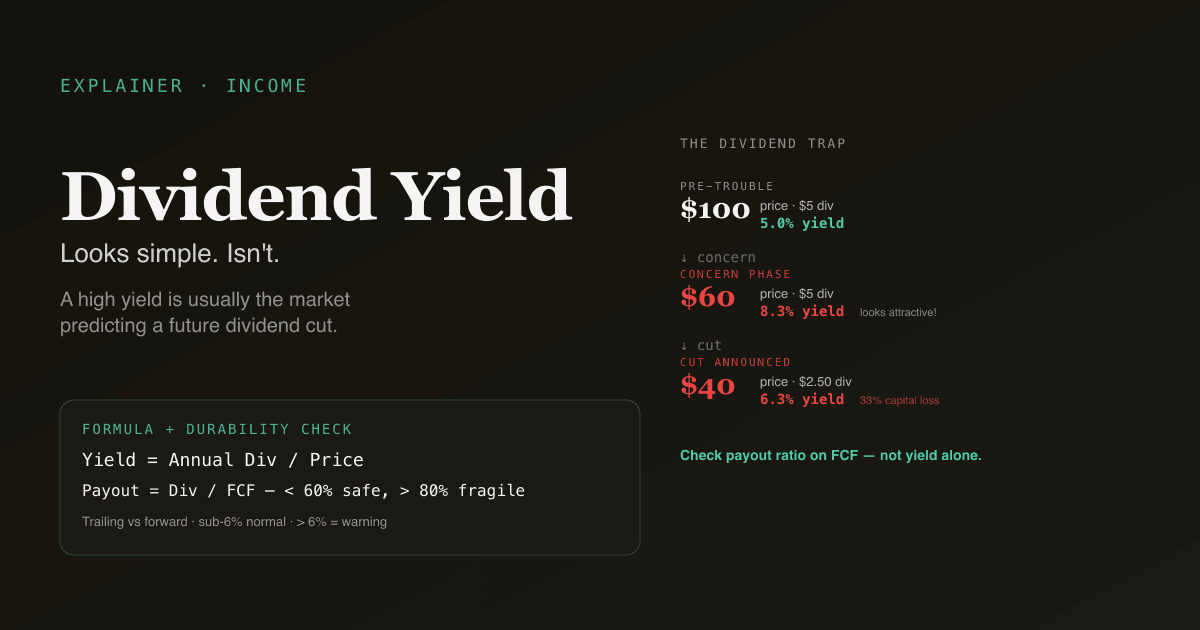 ExplainerMay 26, 2026 · 9 min
What Is Dividend Yield? The Number That Looks Simple but Isn't
Dividend yield = annual dividend per share / price. Formula, why high yield is often a warning sign, the payout ratio that matters, and four pitfalls.
Read post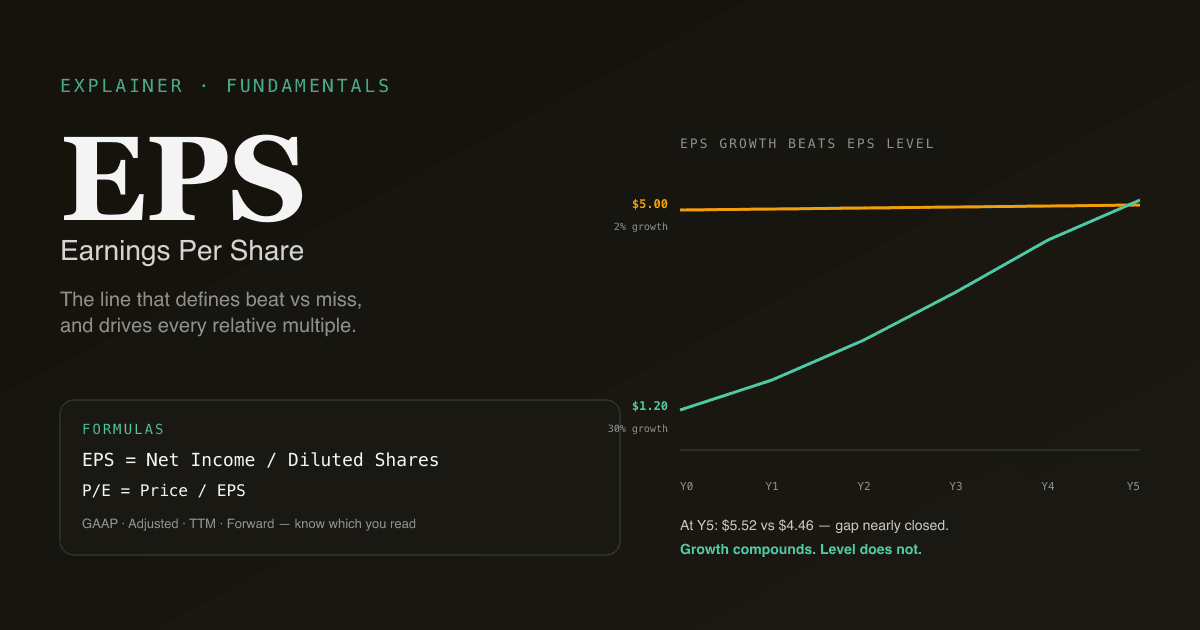 ExplainerMay 26, 2026 · 9 min
What Is EPS (Earnings Per Share)? The Number Wall Street Actually Watches
EPS = net income / diluted share count. Formula, the GAAP vs adjusted distinction, why diluted matters, and four pitfalls retail readers fall into.
Read post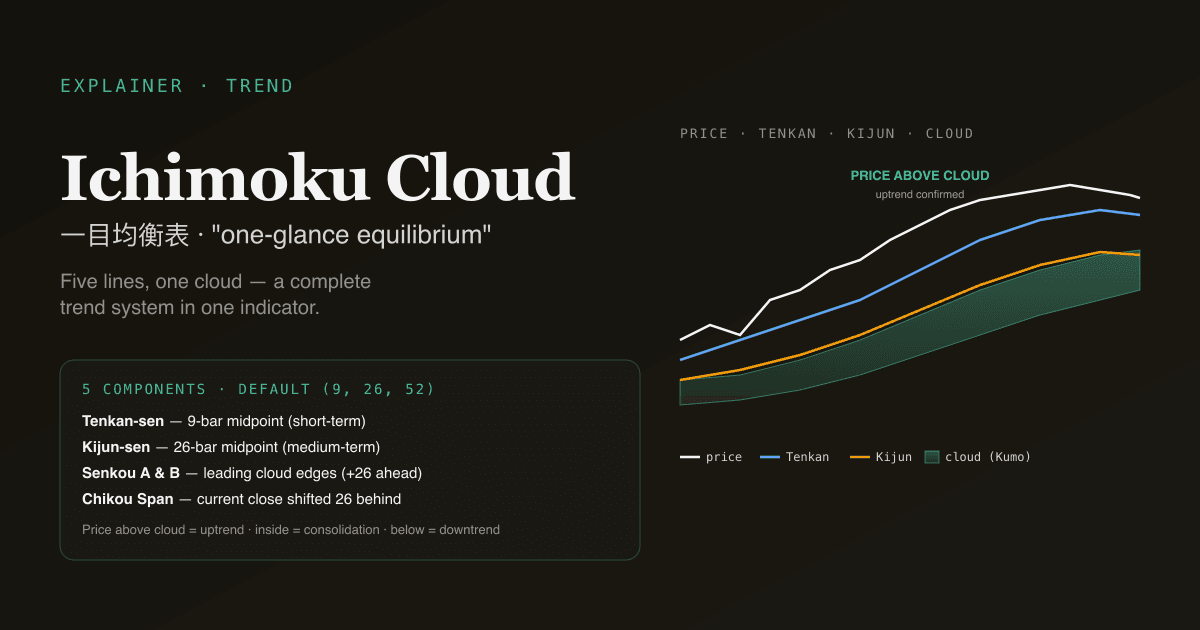 ExplainerMay 26, 2026 · 9 min
What Is the Ichimoku Cloud? A Complete Trading System in One Indicator
Ichimoku is a 5-line system measuring trend, momentum, and support/resistance simultaneously. The Cloud, the 5 components, and how to actually use it.
Read post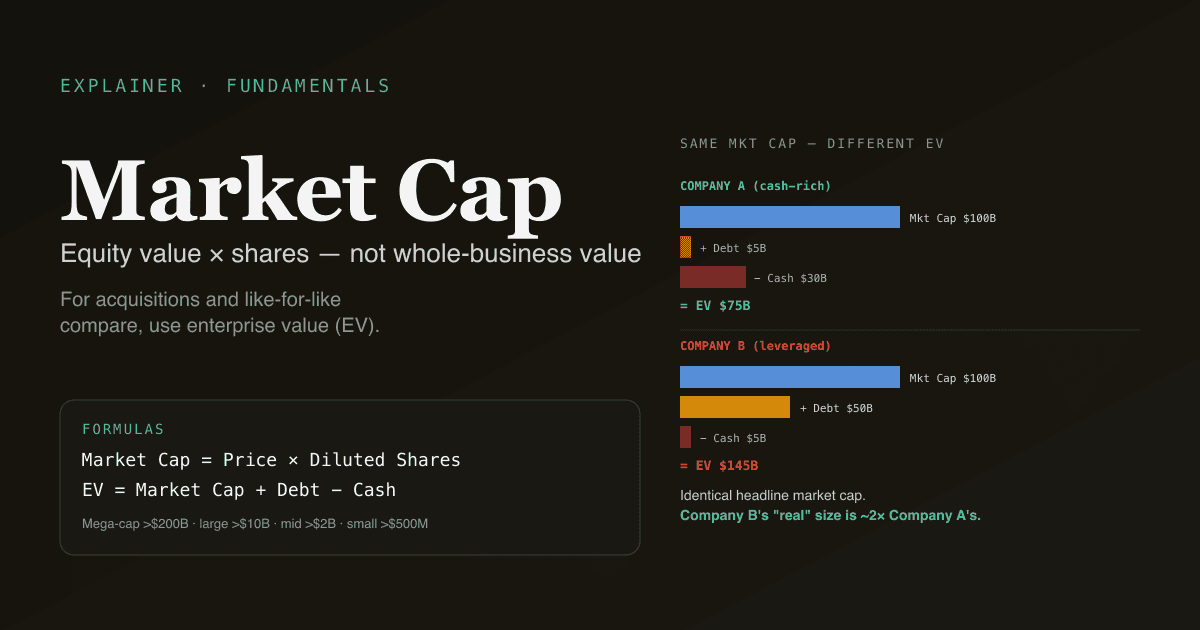 ExplainerMay 26, 2026 · 10 min
What Is Market Cap? Why Size Matters More Than Most Retail Realizes
Market cap = price × shares outstanding. Small / mid / large / mega-cap definitions, why enterprise value matters more, and four pitfalls retail readers fall into.
Read post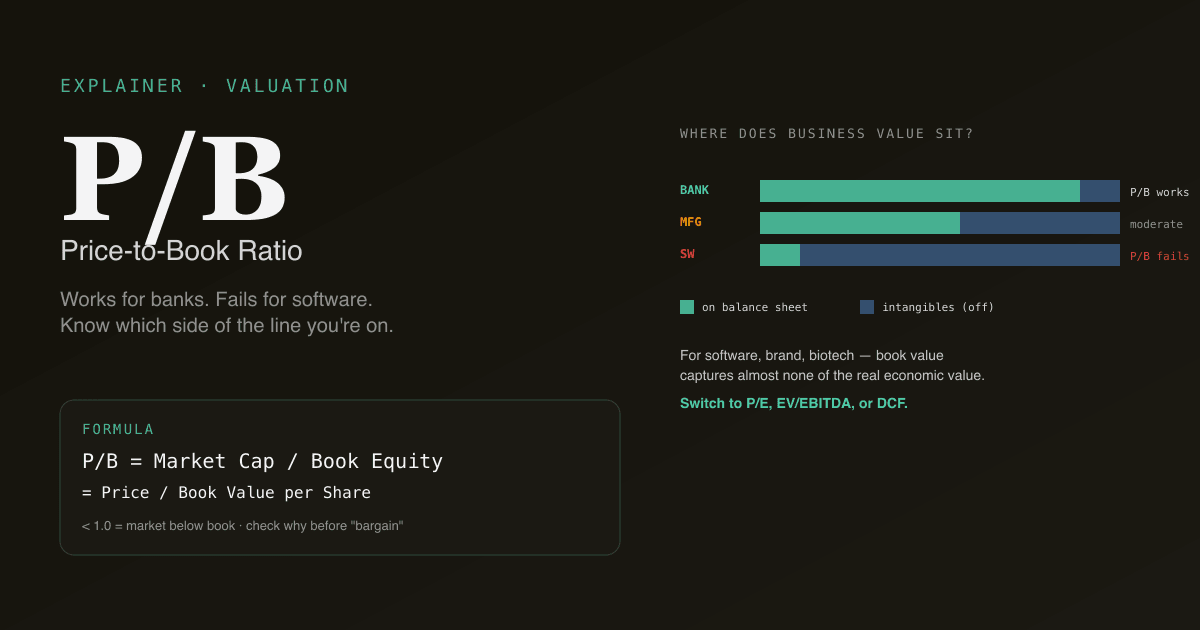 ExplainerMay 26, 2026 · 10 min
What Is the P/B Ratio? Price-to-Book Explained for Real Investors
P/B = price per share / book value per share. Formula, why P/B works for banks but not software, the trap of intangibles, and four pitfalls retail readers fall into.
Read post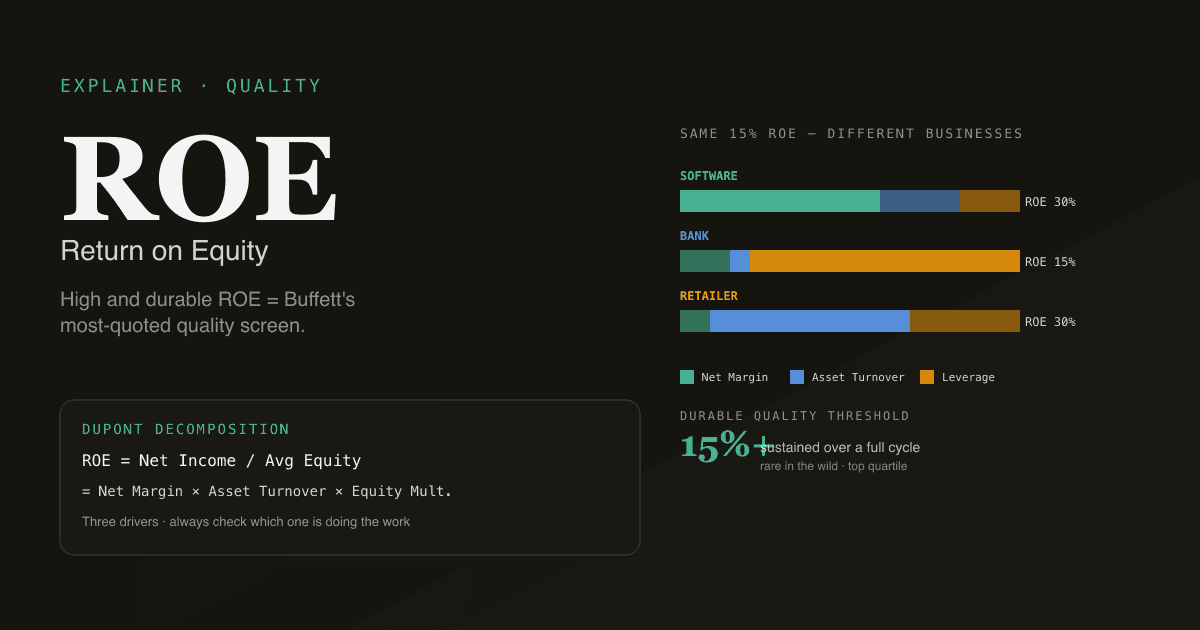 ExplainerMay 26, 2026 · 9 min
What Is ROE (Return on Equity)? The Quality Indicator Buffett Lives By
ROE = net income / shareholders' equity. Formula, the DuPont decomposition, why leverage inflates ROE, and how to spot quality businesses with high durable ROE.
Read post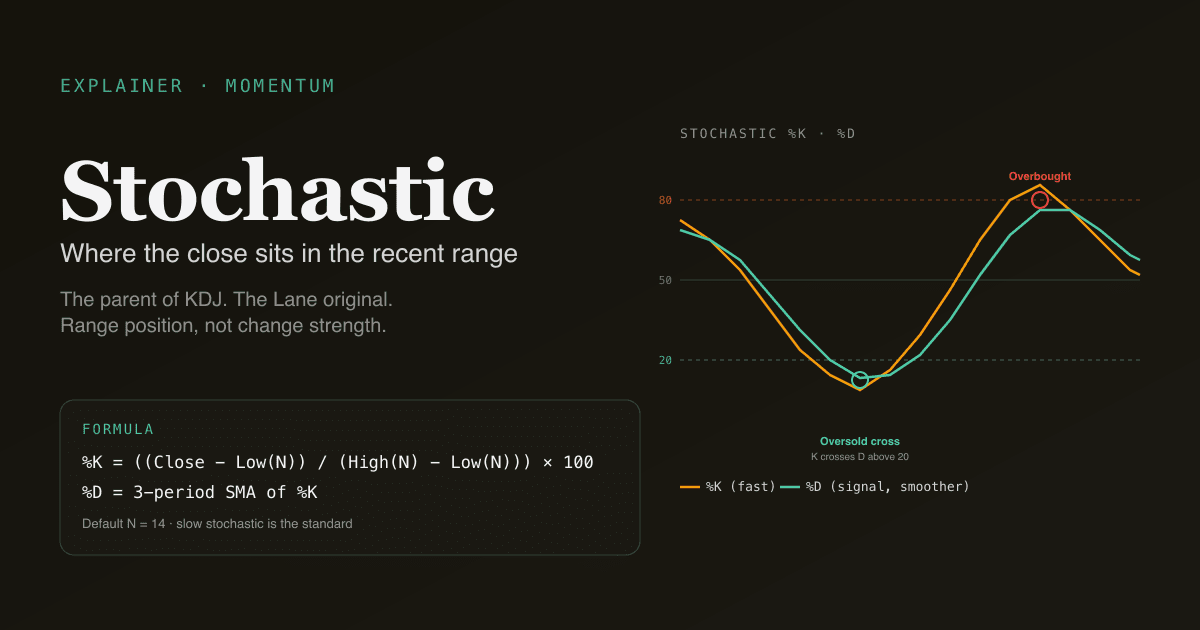 ExplainerMay 26, 2026 · 9 min
What Is the Stochastic Oscillator? %K, %D, and Why KDJ Is Its Cousin
Stochastic measures where close sits within the recent range. Formula, fast vs slow stochastic, the relationship to KDJ, and four pitfalls retail readers fall into.
Read post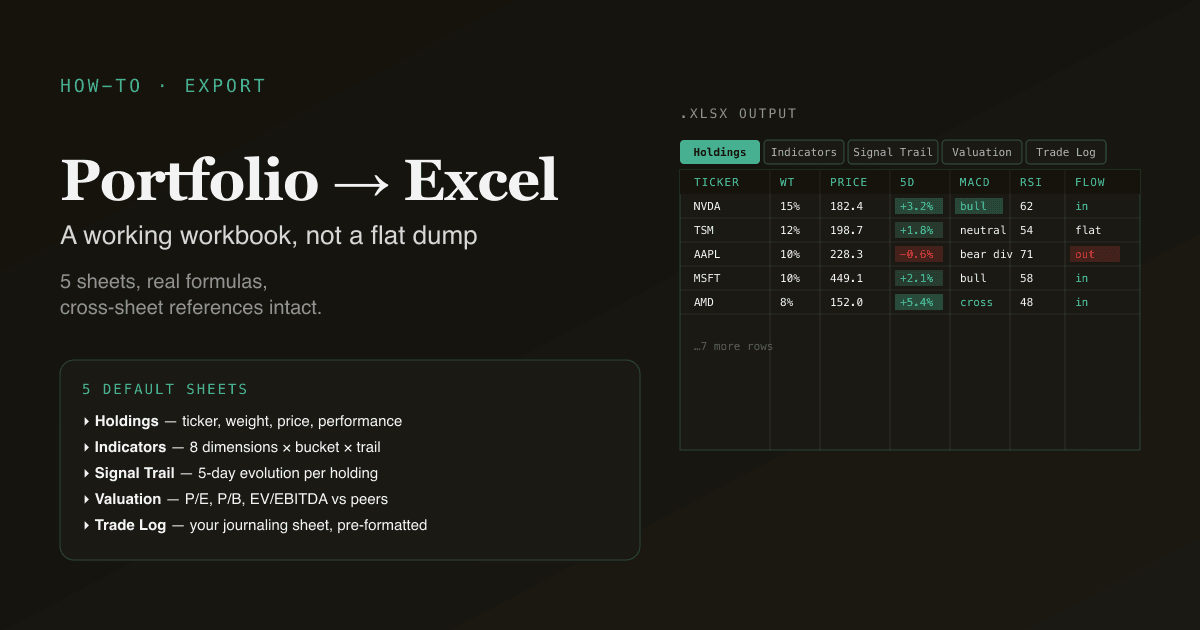 How-toMay 25, 2026 · 9 min
How to Export a Portfolio Report to Excel in 60 Seconds
Generate a multi-sheet Excel workbook from your PickSkill portfolio — holdings, indicators, valuation, signal trails. Real formulas, sortable tables, ready to share.
Read post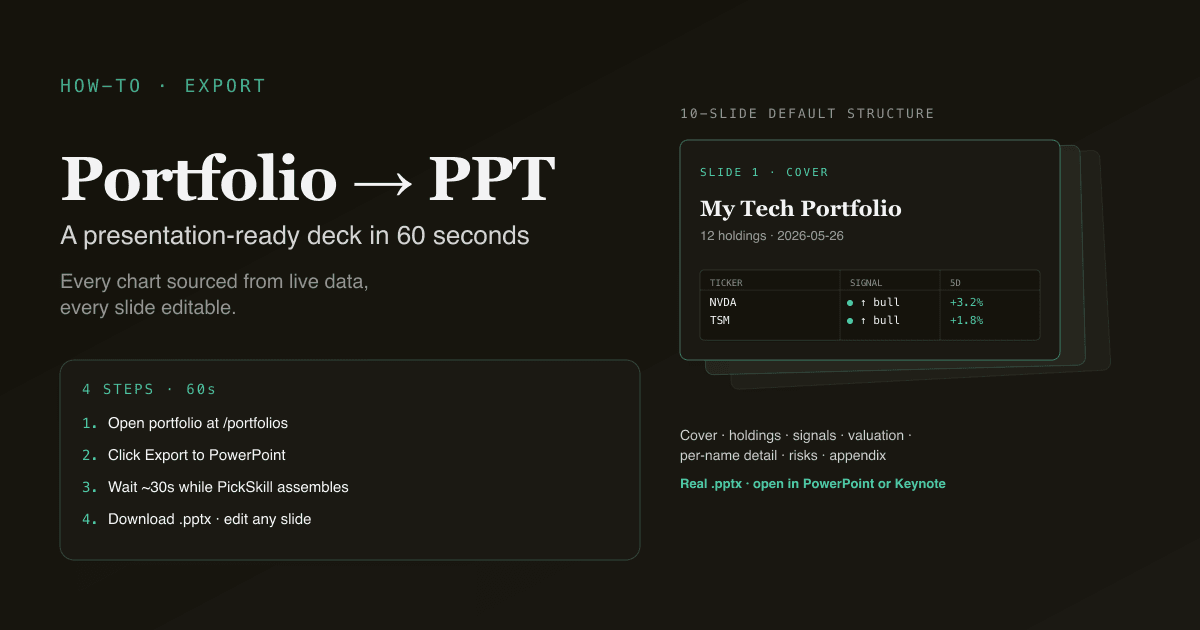 How-toMay 25, 2026 · 9 min
How to Export a Portfolio Analysis to PowerPoint in 60 Seconds
Generate a presentation-ready PPTX from your PickSkill portfolio — every chart sourced, every slide editable. 4 steps, one prompt, designed for live presentation.
Read post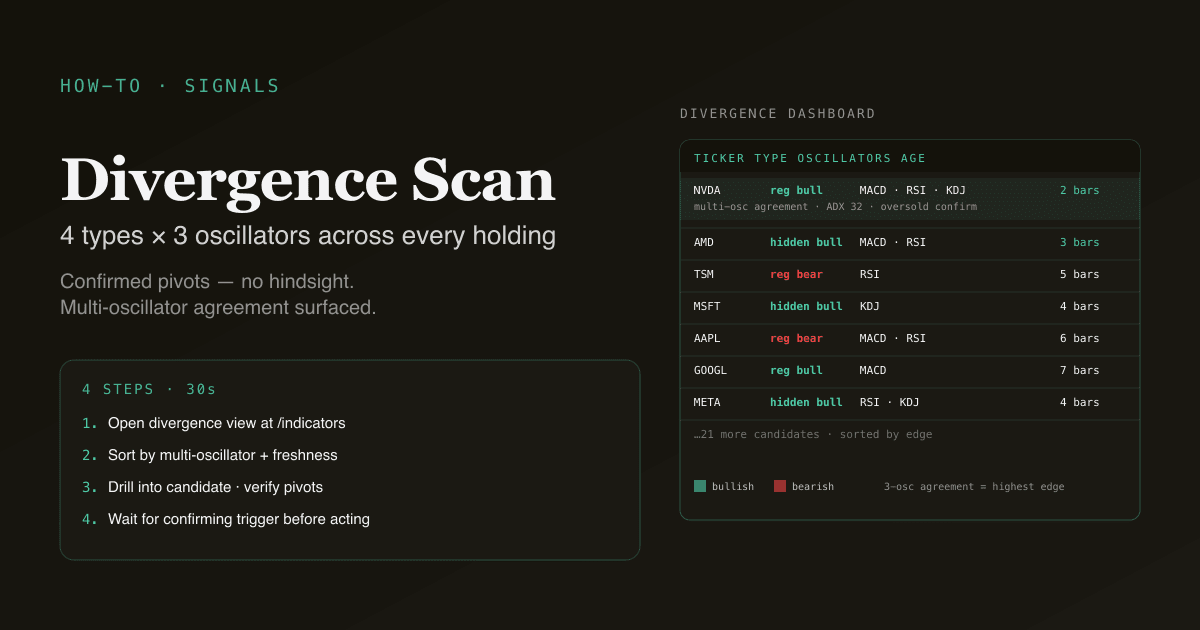 How-toMay 25, 2026 · 10 min
How to Find Bullish Divergences Across a Portfolio in 30 Seconds
PickSkill's divergence dashboard scans every holding for the 4 divergence types across MACD, RSI, and KDJ — surfacing only well-defined pivots. Workflow in 4 steps.
Read post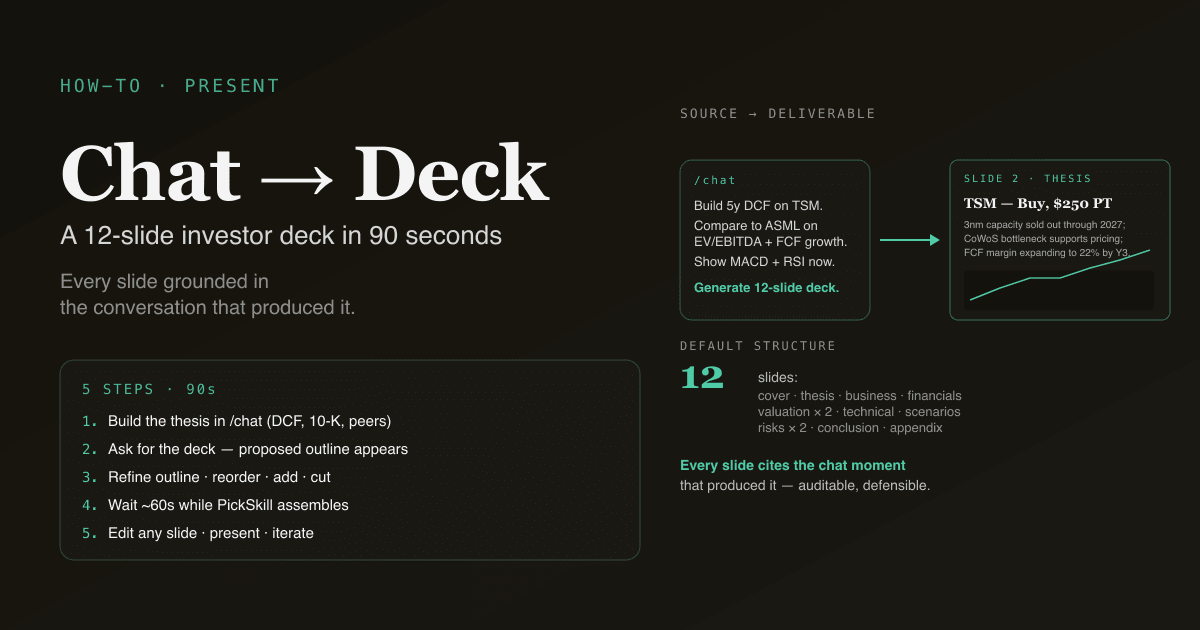 How-toMay 25, 2026 · 9 min
How to Generate an Investor Deck from a Chat in 90 Seconds
Turn a research chat into a slide-ready investor presentation — thesis, financials, comparables, risks. One prompt, one PPTX, every slide editable.
Read post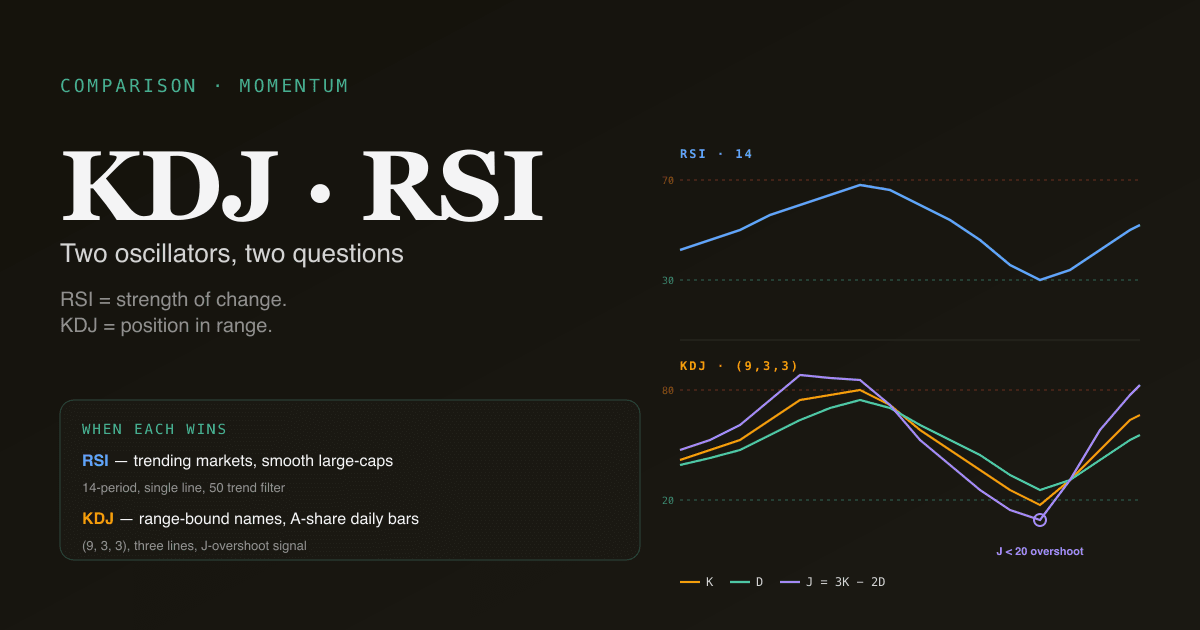 ExplainerMay 25, 2026 · 9 min
KDJ vs RSI — Which Momentum Oscillator Should You Use?
KDJ and RSI both measure momentum, but on different formulas and timeframes. Side-by-side comparison, when each one wins, and how to combine them.
Read post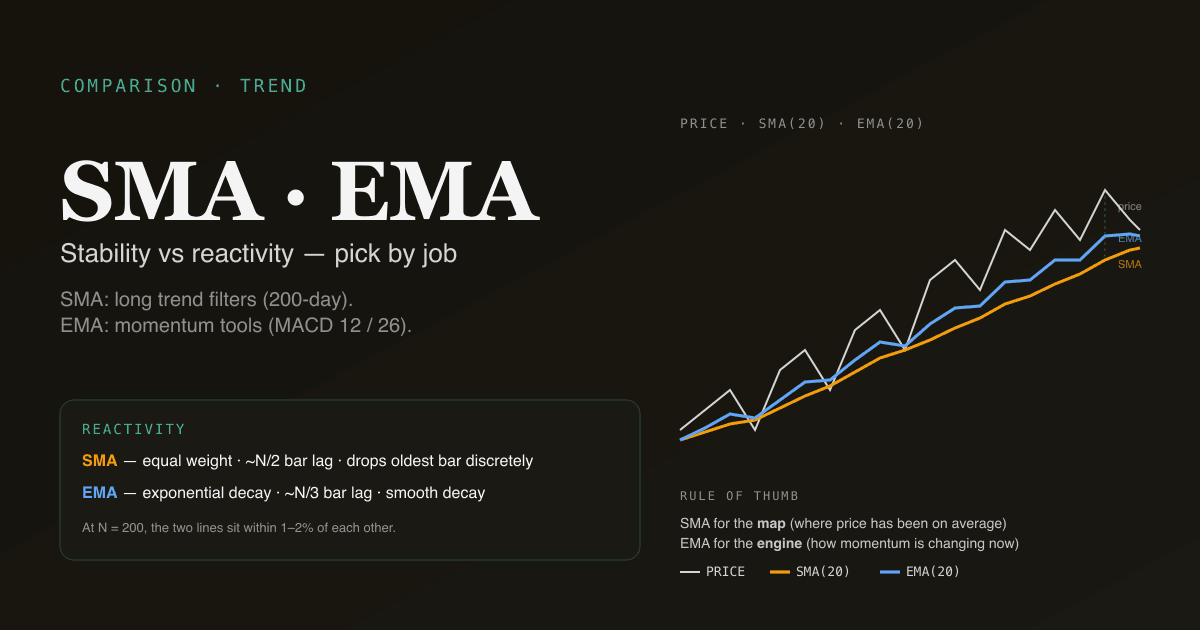 ExplainerMay 25, 2026 · 11 min
SMA vs EMA — Which Moving Average Should You Use?
SMA weighs every bar equally; EMA weighs recent bars more. Side-by-side comparison, when each one wins, and why the 200-day SMA matters more than its EMA cousin.
Read post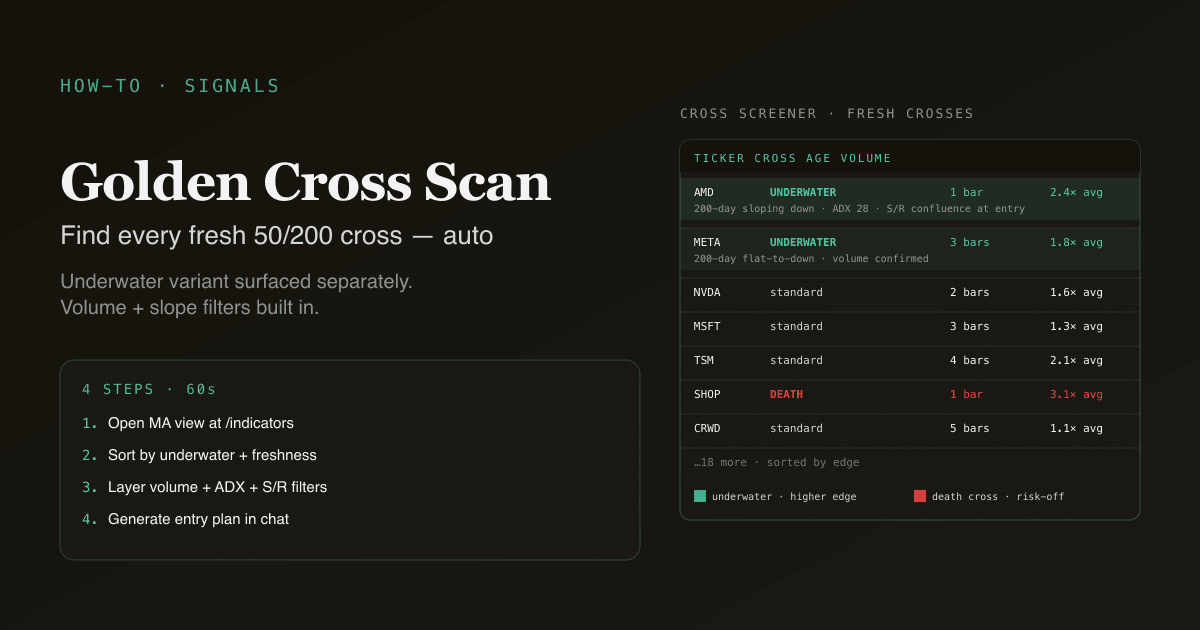 How-toMay 25, 2026 · 10 min
How to Screen Stocks for a Golden Cross in 60 Seconds
Find every stock in your watchlist with a fresh 50/200 MA cross — and the higher-edge underwater variant. Workflow in 4 steps with PickSkill.
Read post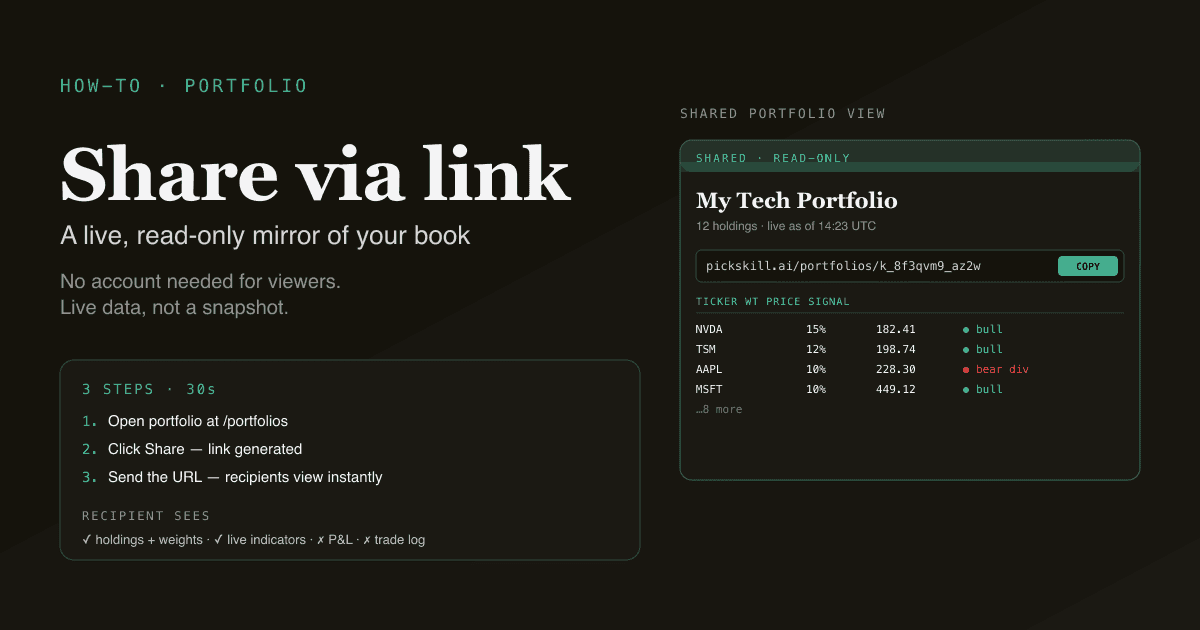 How-toMay 25, 2026 · 9 min
How to Share a Portfolio via Link (and Why You Should)
PickSkill portfolios can be shared as a single URL — live indicator dashboards, latest signals, valuation snapshots — with no account required. 3 steps and 30 seconds.
Read post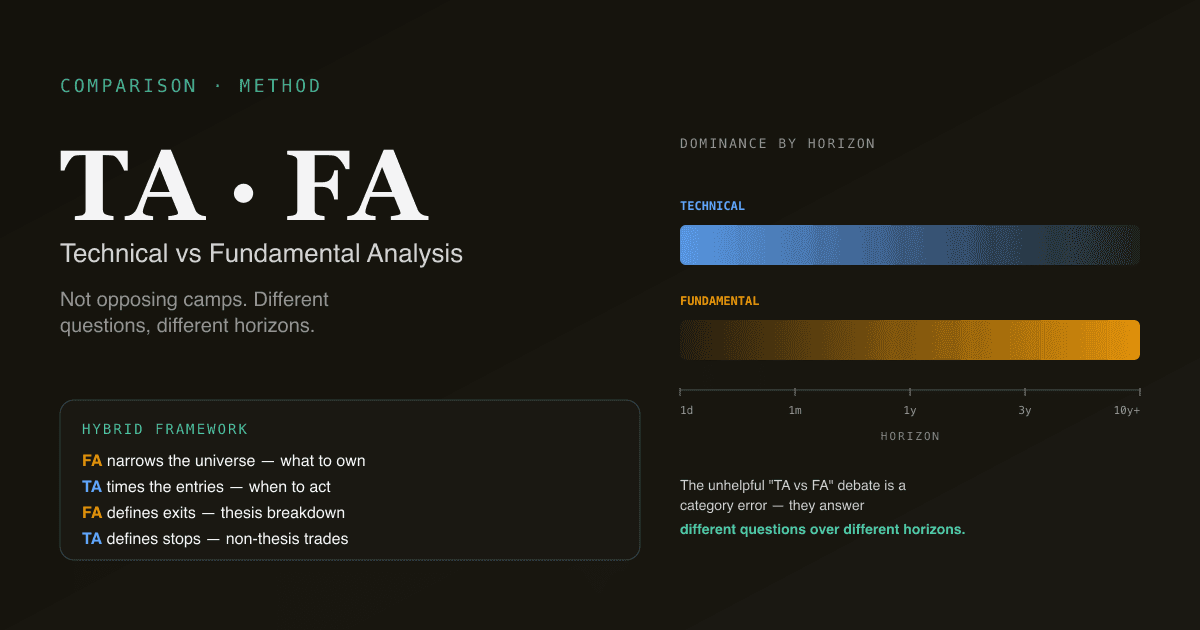 ExplainerMay 25, 2026 · 10 min
Technical vs Fundamental Analysis — Which One Actually Works?
Technical analysis trades patterns in price and volume; fundamental analysis values the underlying business. Side-by-side comparison and how to combine them.
Read post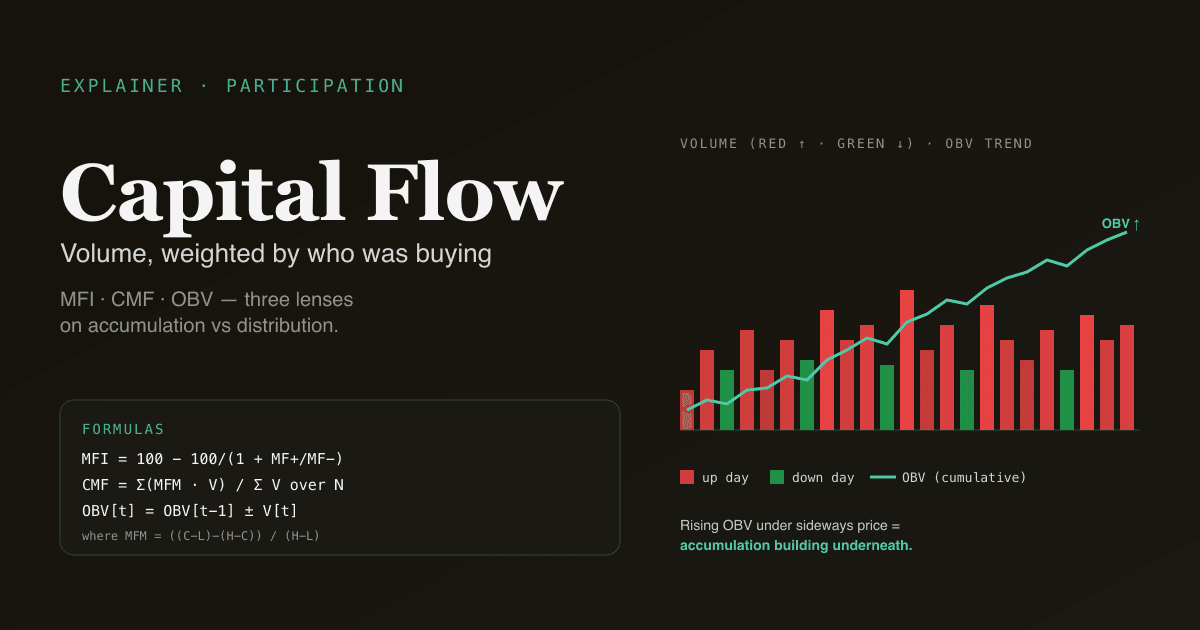 ExplainerMay 25, 2026 · 10 min
What Is Capital Flow? Money-Flow Indicators, Explained
Capital flow measures whether money is entering or exiting a stock on a given bar — using price-direction-weighted volume. MFI, CMF, OBV — formulas, uses, pitfalls.
Read post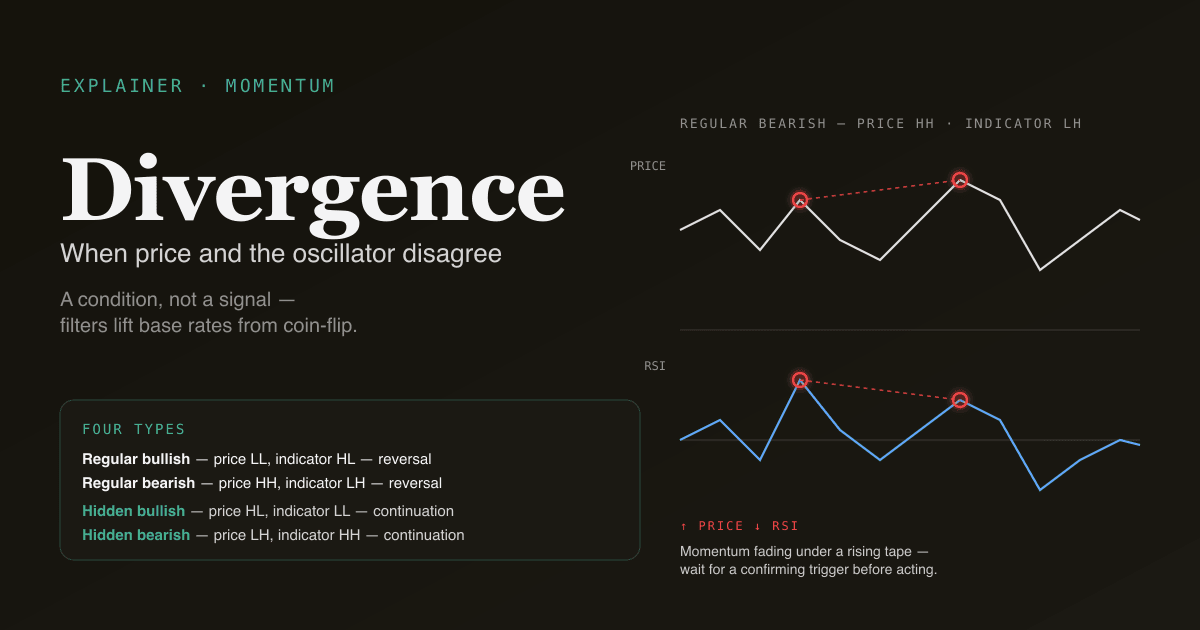 ExplainerMay 25, 2026 · 10 min
What Is Divergence? Bullish, Bearish, and the Hidden Variant Retail Misses
Divergence is when price and an indicator disagree on direction. Definition, the 4 standard types, why most divergences fail, and how to filter the ones that don't.
Read post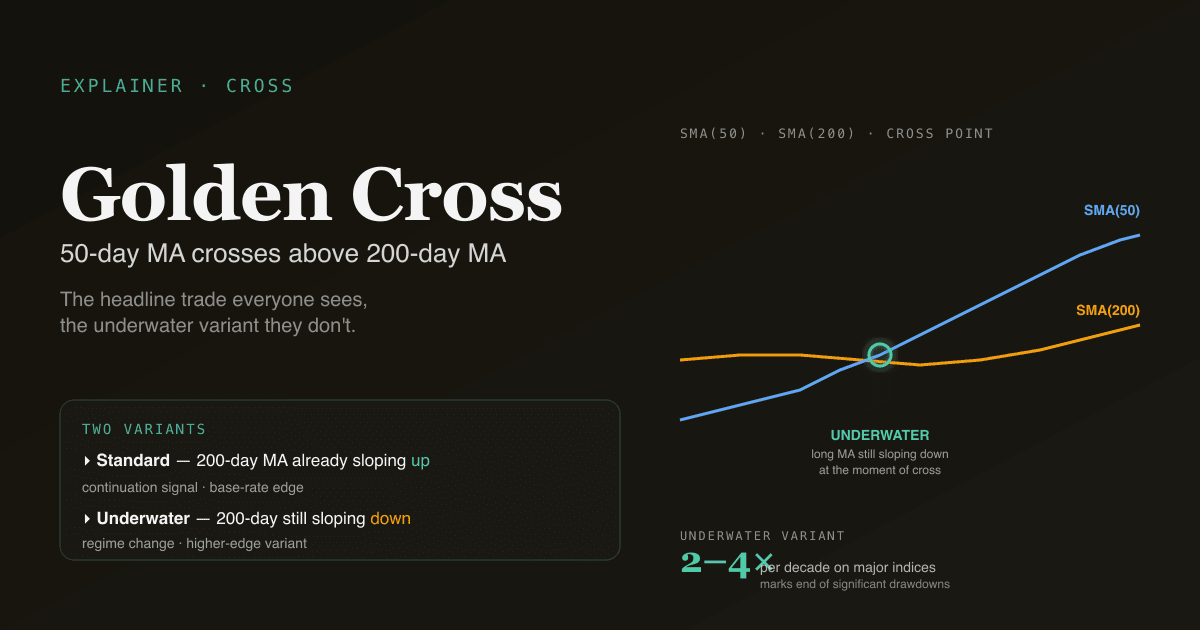 ExplainerMay 25, 2026 · 10 min
What Is a Golden Cross (and Death Cross)? The 50/200 MA Signal, Explained
A golden cross is the 50-day MA crossing above the 200-day MA. Formula, historical hit rates, why the cross alone is overrated, and how to use it properly.
Read post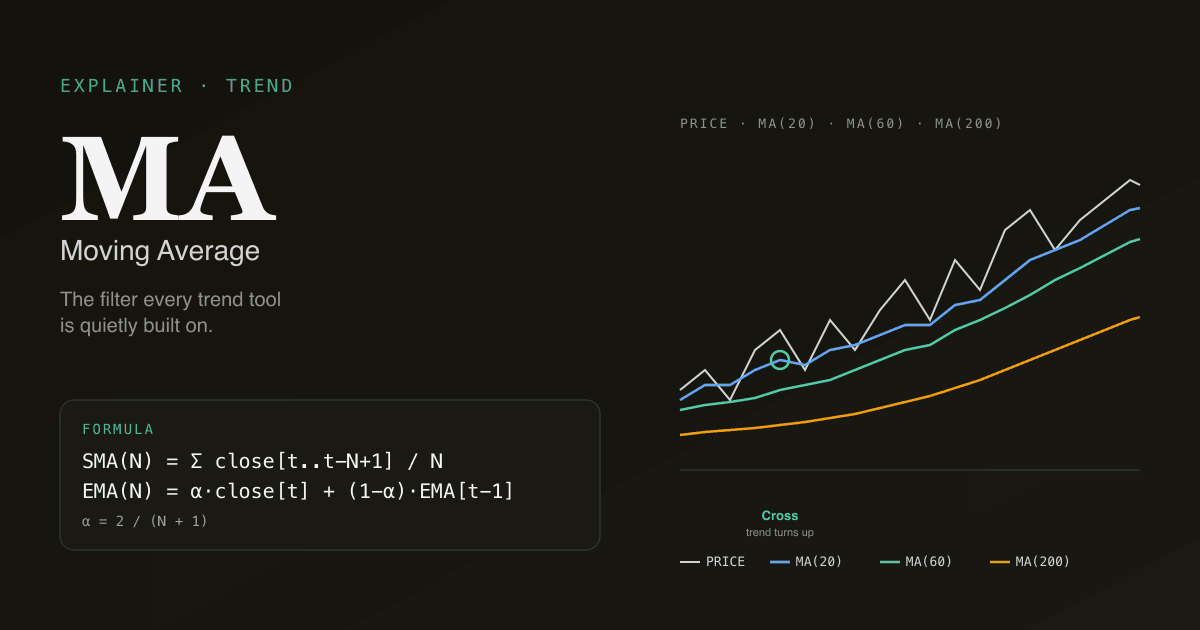 ExplainerMay 25, 2026 · 9 min
What Is a Moving Average? SMA, EMA, and the Trend Filter Everyone Uses
A moving average is the rolling mean of close price over N bars. Formula, why 20/60/200 are the standard windows, and four pitfalls retail readers fall into.
Read post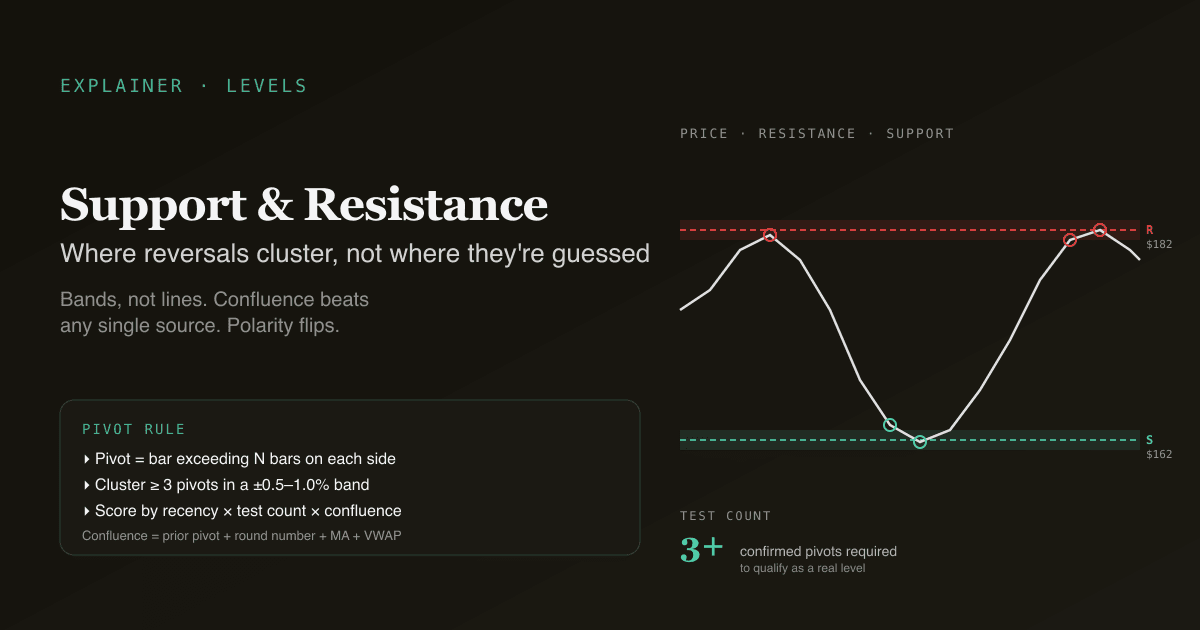 ExplainerMay 25, 2026 · 10 min
What Are Support and Resistance? The Levels That Actually Matter
Support and resistance are price levels where reversals cluster. How to identify them objectively, why round numbers and prior highs work, and four pitfalls.
Read post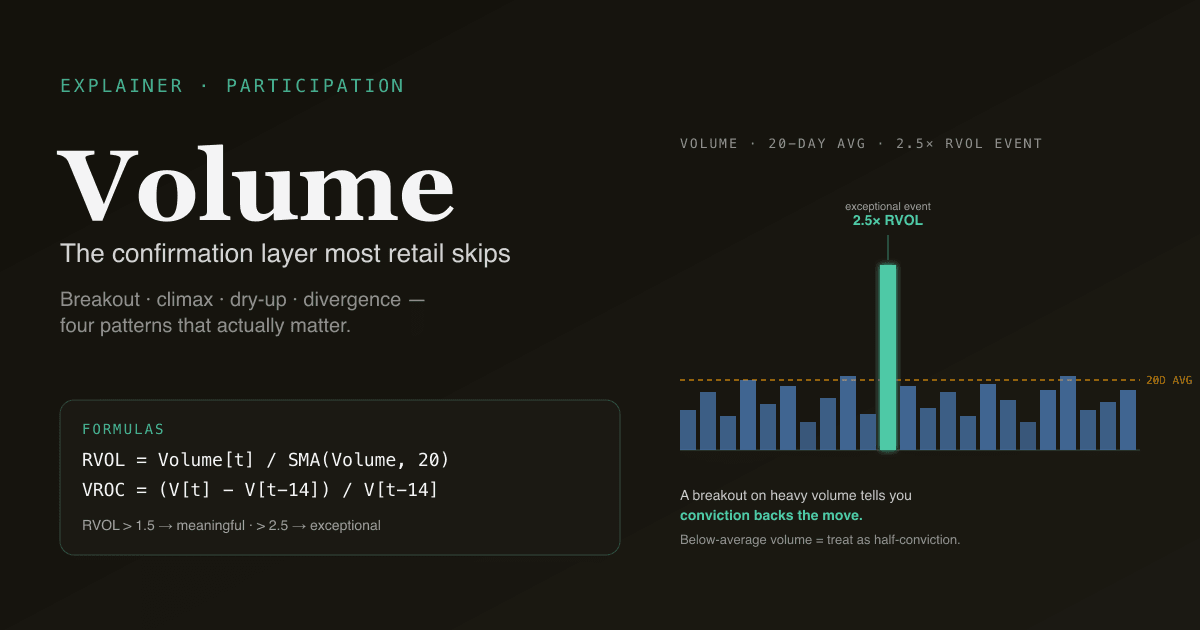 ExplainerMay 25, 2026 · 11 min
What Is Volume Analysis? The Confirmation Layer Most Retail Skips
Volume measures market participation behind every price move. Why volume confirms breakouts, the 4 volume patterns that matter, and how to read VROC and volume profile.
Read post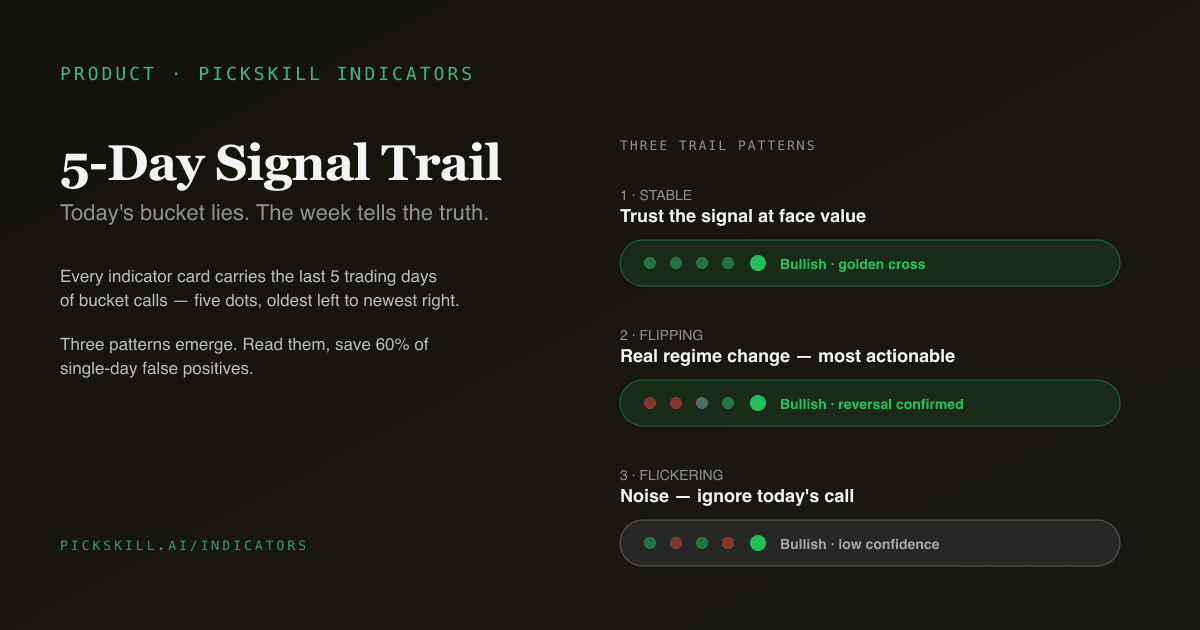 Build in publicMay 23, 2026 · 10 min
5-Day Signal Trail: Why Today's Indicator Lies
Every chart app shows today's indicator call. None show the 5-day trail. Three patterns and why this filters 60% of false signals.
Read post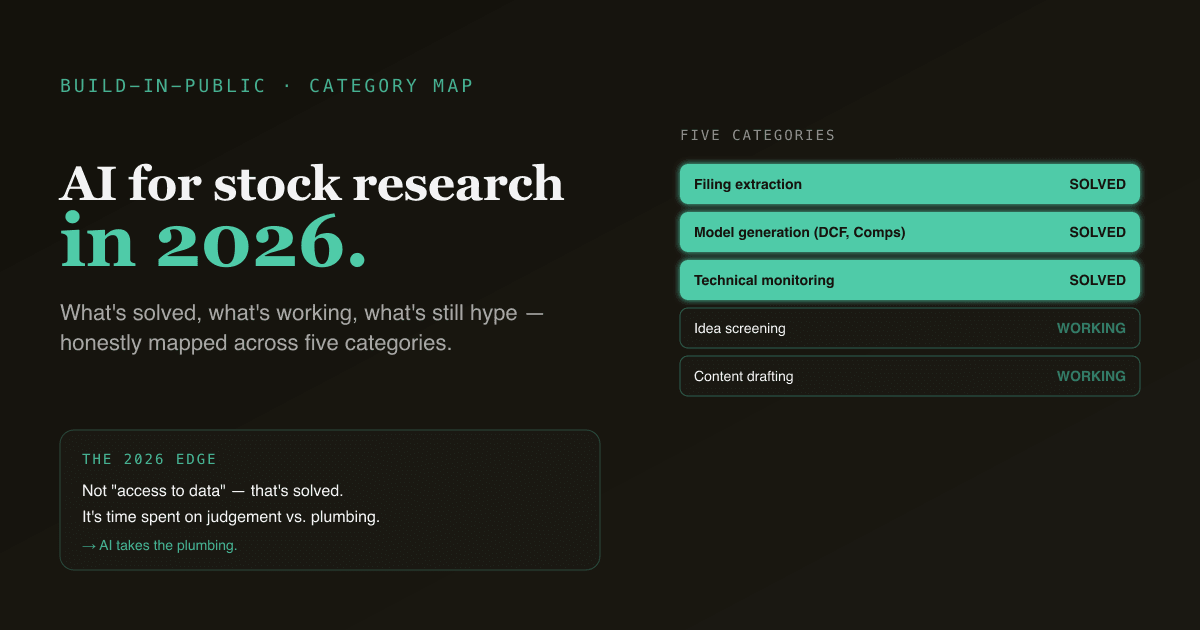 Build in publicMay 23, 2026 · 8 min
AI for Stock Research in 2026 — What Actually Works (and What Doesn't)
A build-in-public category map of AI in equity research today. Five categories — three solved, two still working with editorial input.
Read post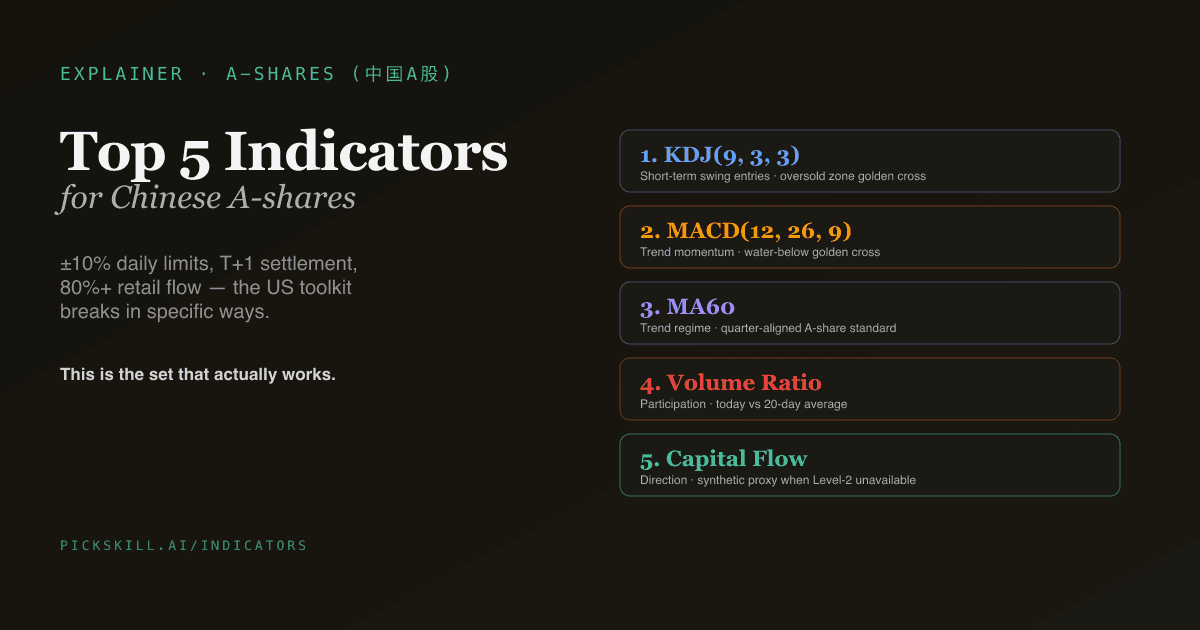 ExplainerMay 23, 2026 · 11 min
Top 5 Technical Indicators for Chinese A-Shares
A-shares have ±10% limits, T+1 settlement, 80% retail flow. The 5 indicators that actually work: KDJ + MACD + MA60 + Volume + Capital Flow.
Read post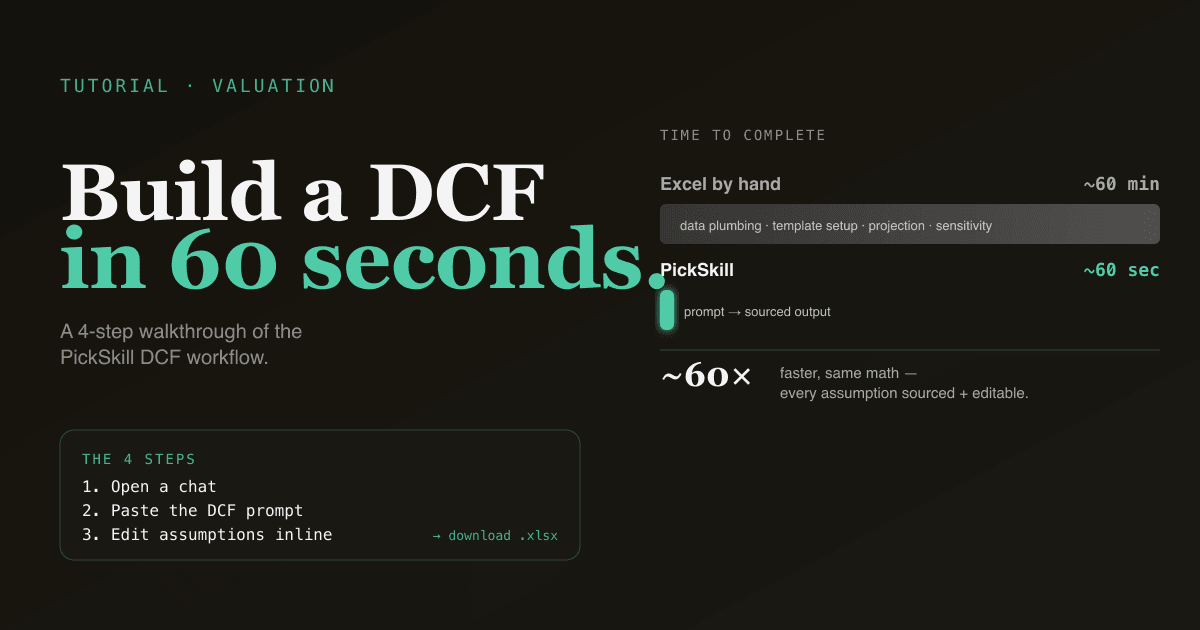 How-toMay 23, 2026 · 8 min
How to Build a DCF in 60 Seconds with PickSkill
Open a chat, paste one prompt, get a sourced 5-year DCF in Excel — every input linked, every assumption editable. Works on US, HK, A-share tickers.
Read post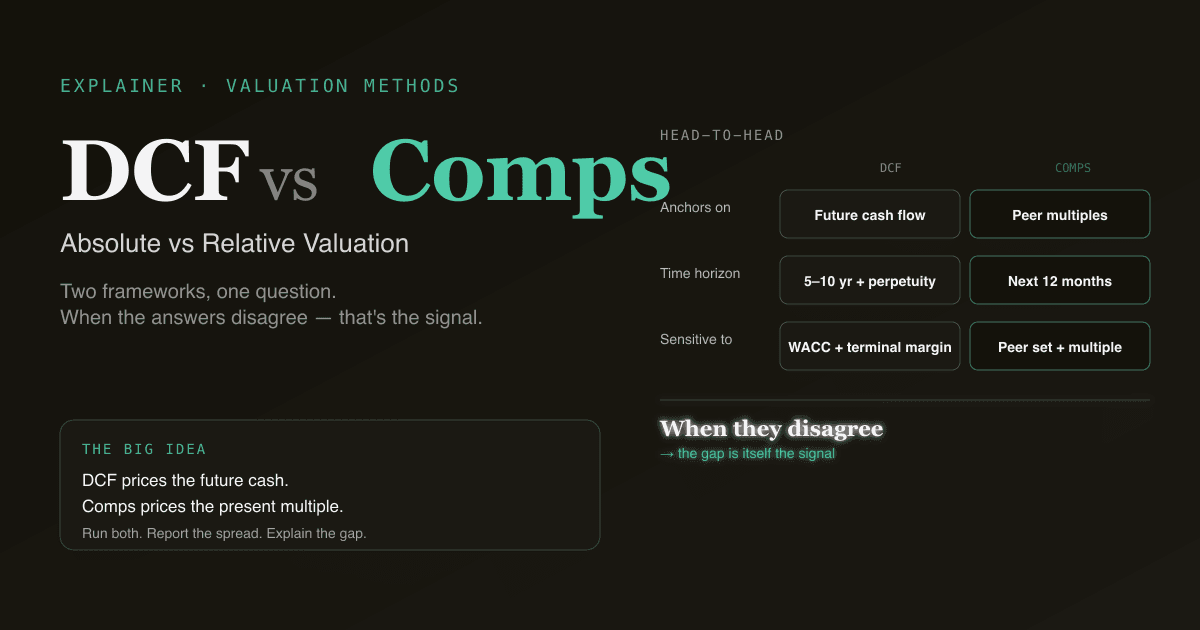 ExplainerMay 23, 2026 · 9 min
DCF vs Comparable Company Analysis — Which to Use, When
DCF prices the future cash; Comps price the present multiple. When to use each, the failure modes of each, why professionals triangulate both.
Read post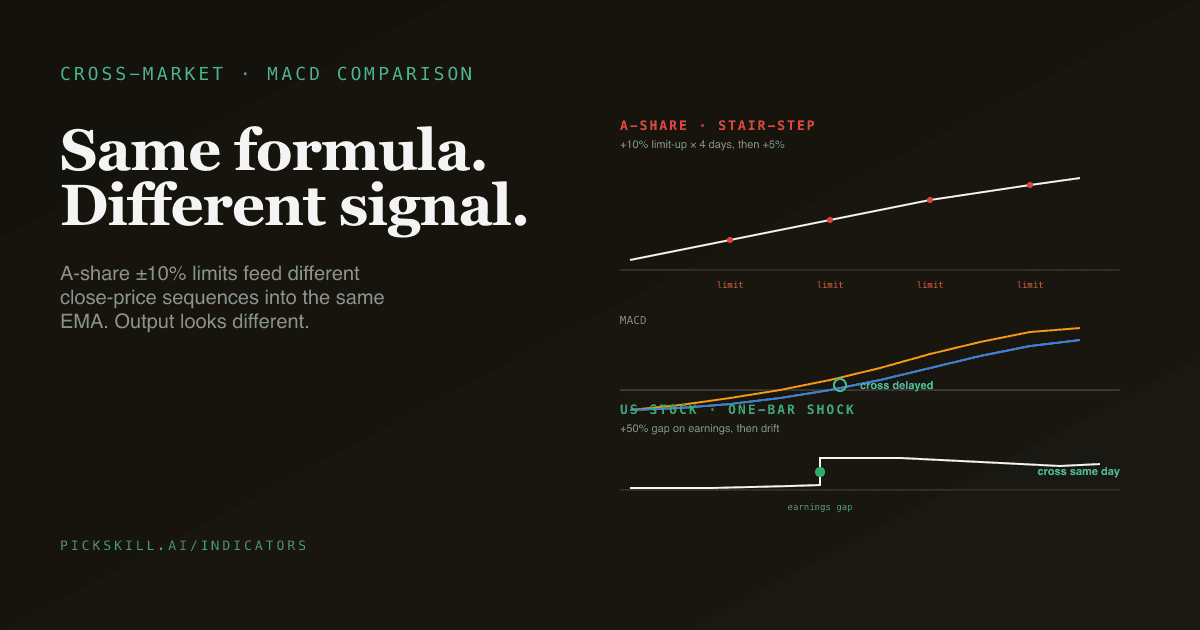 MacroMay 23, 2026 · 9 min
MACD on A-Shares vs US — Same Formula, Different Signal
A-share ±10% limits and T+1 settlement feed different inputs into the same MACD formula. Four differences and how to handle them.
Read post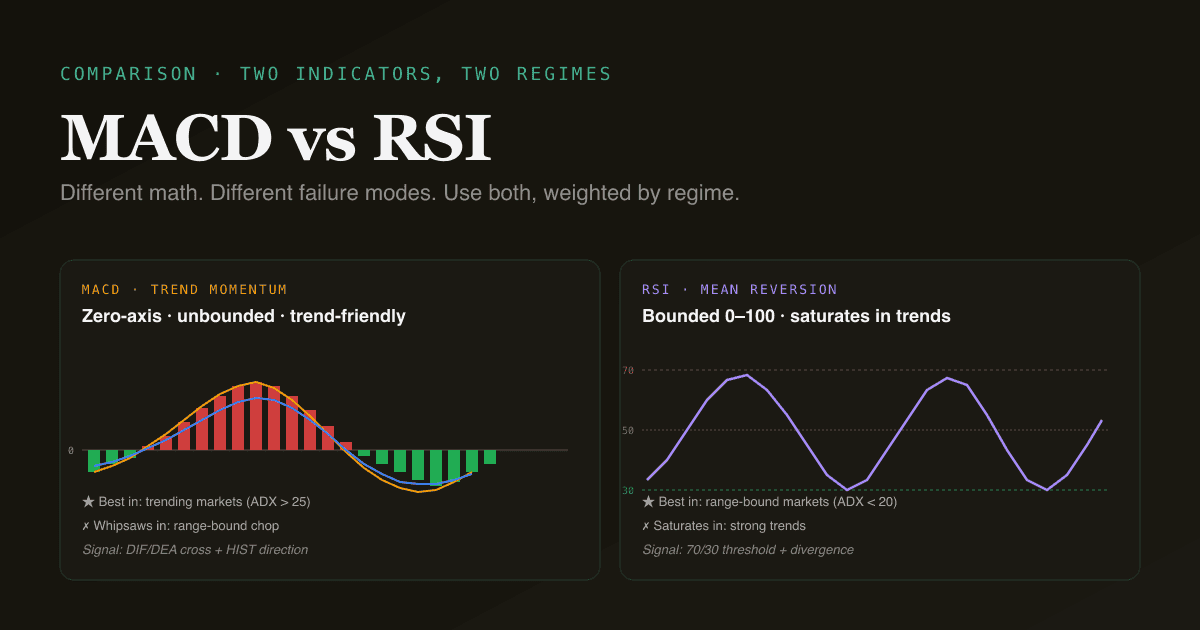 ExplainerMay 23, 2026 · 8 min
MACD vs RSI — Which Should You Use, and When?
MACD is trend-momentum (zero-axis, unbounded); RSI is mean-reversion (0–100). Comparison table, regime-aware framework, combined workflow.
Read post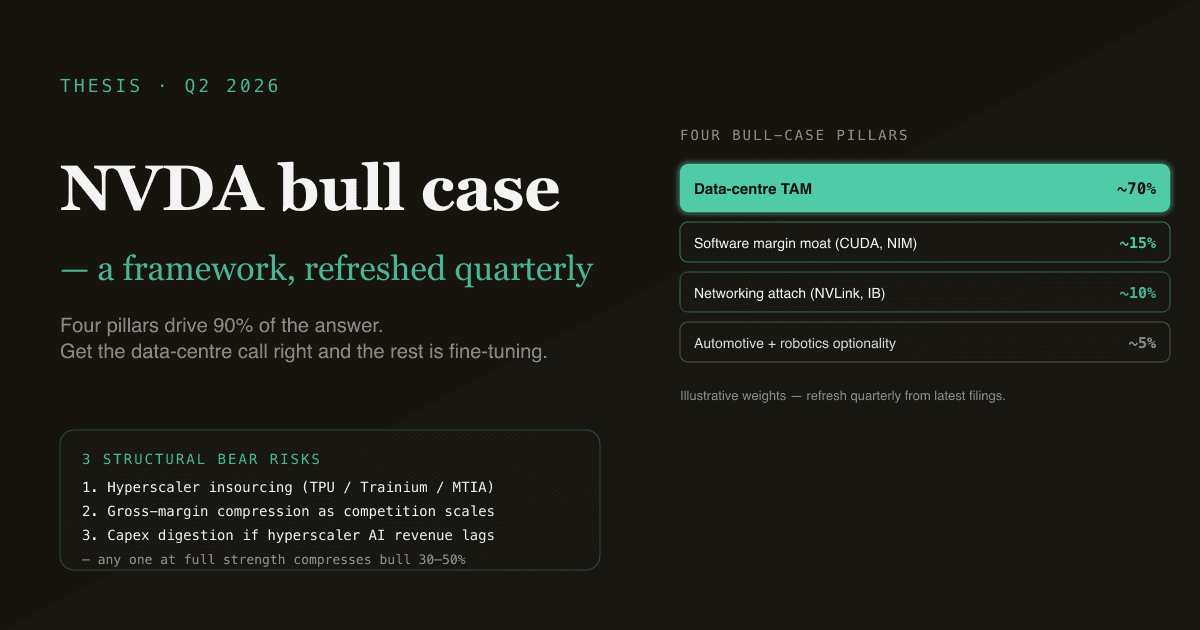 ThesisMay 23, 2026 · 8 min
NVDA Bull Case — Q2 2026 Thesis Framework
A worked thesis framework for Nvidia — four pillars, three structural bear risks, and the four assumptions to track quarterly. Refreshed each filing.
Read post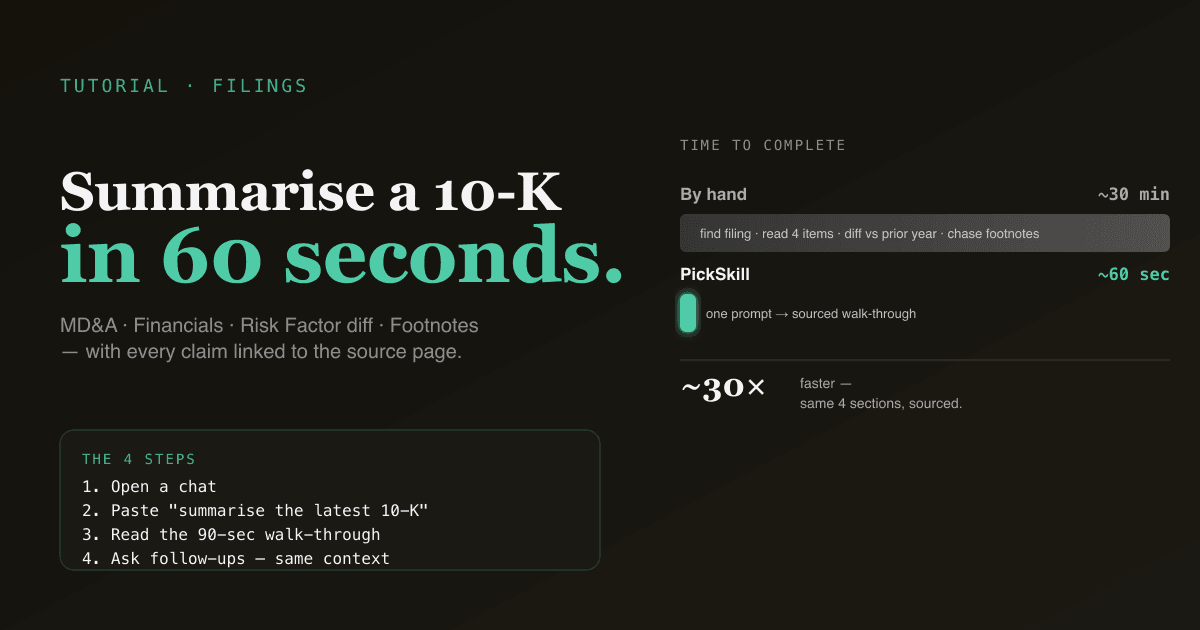 How-toMay 23, 2026 · 6 min
How to Summarise Any 10-K in 60 Seconds with PickSkill
Paste one prompt → MD&A highlights, FCF, net debt, segment growth, year-over-year Risk Factor diff, and footnotes — every claim linked to EDGAR.
Read post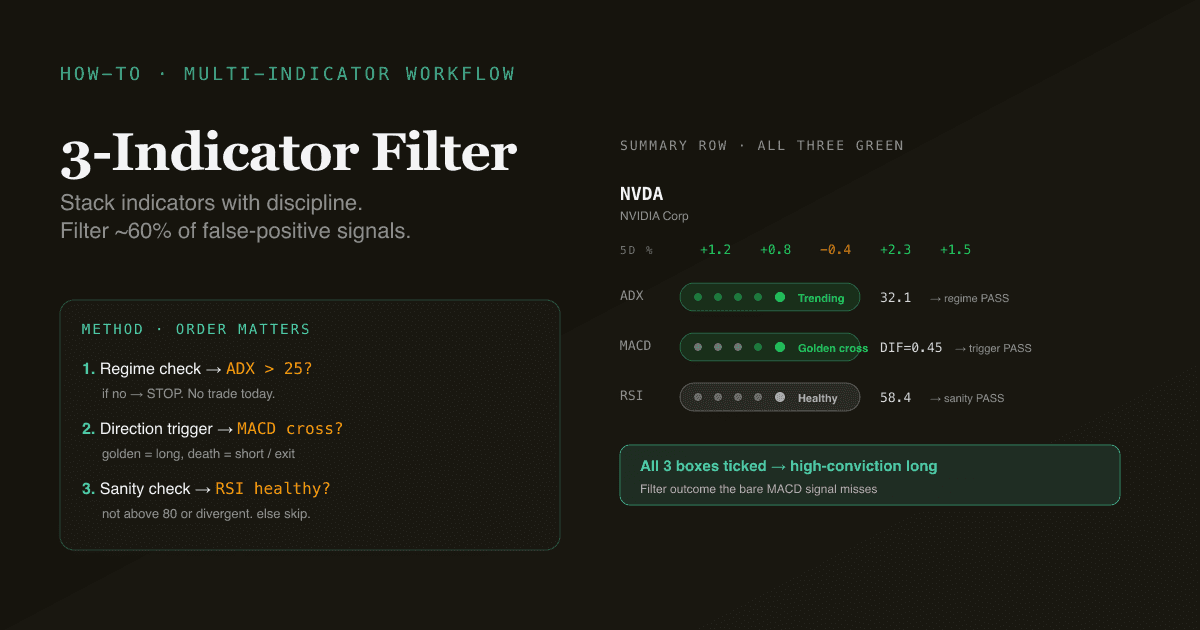 How-toMay 23, 2026 · 10 min
3-Indicator Filter: MACD + RSI + ADX, the Right Way
Stack indicators with discipline. ADX as regime filter, MACD as trigger, RSI as sanity check. Worked examples that filter false positives.
Read post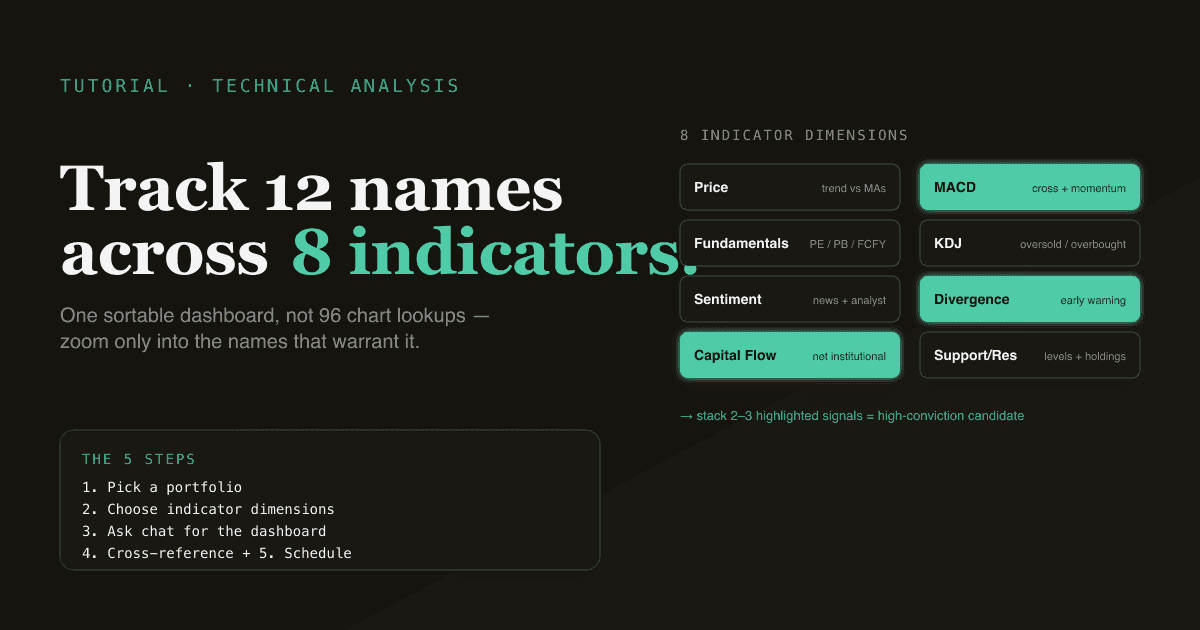 How-toMay 23, 2026 · 6 min
Track a Multi-Stock Portfolio with Technical Indicators
A 5-step tutorial: set up a portfolio, layer 8 indicator dimensions, and use AI dashboards (MACD, KDJ, divergence, flow) to spot signals.
Read post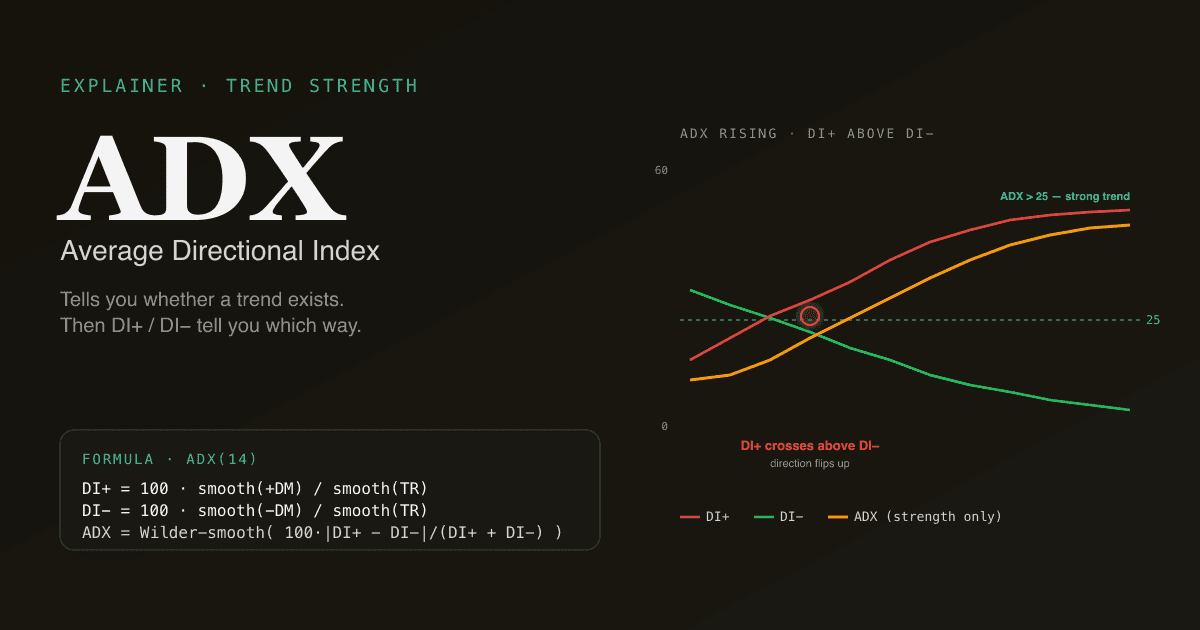 ExplainerMay 23, 2026 · 9 min
What Is ADX? The Indicator That Tells You When Not to Trade
ADX is a 14-period Wilder measure of trend strength, paired with DI+ and DI−. Formula, why ADX < 20 means stay out, and the 3-indicator filter.
Read post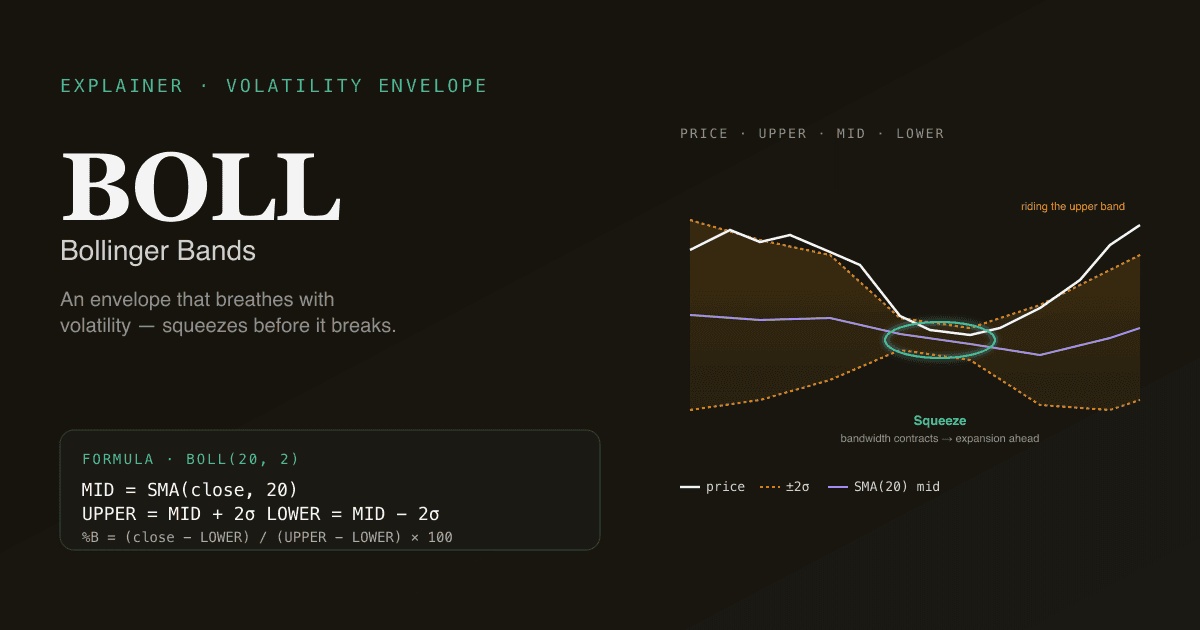 ExplainerMay 23, 2026 · 9 min
What Are Bollinger Bands? Squeeze Before It Breaks
Bollinger Bands = 20-period SMA ± 2 stdev. Formula, what %B and bandwidth tell you, and why "the squeeze" beats simple band touches.
Read post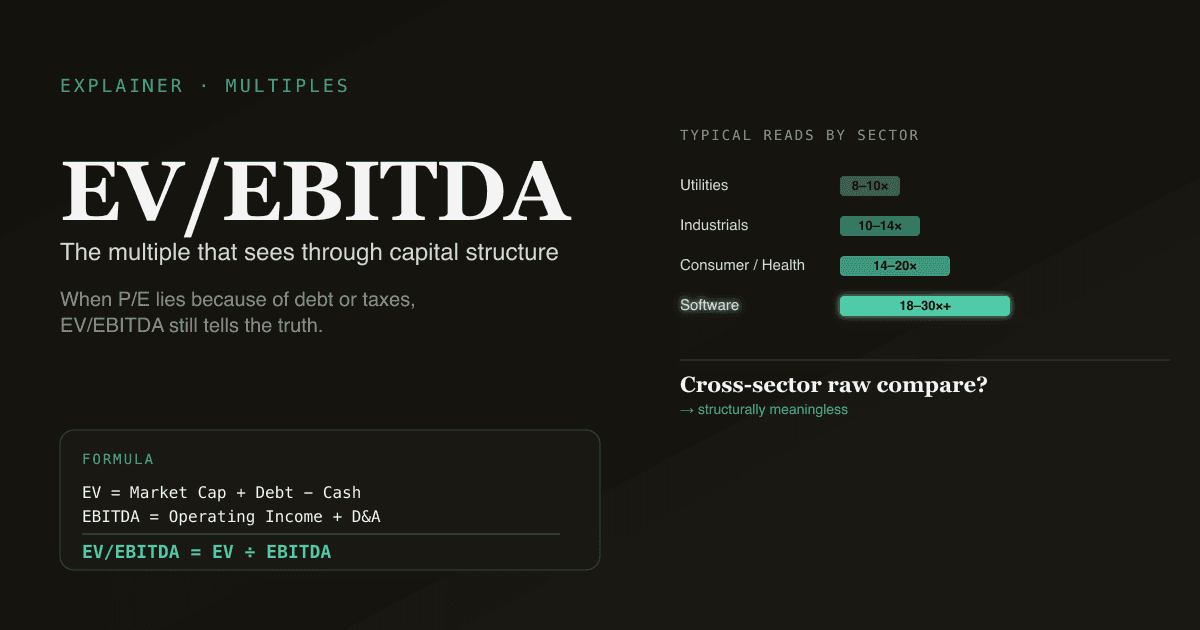 ExplainerMay 23, 2026 · 6 min
What Is EV/EBITDA? The Multiple That Sees Through Capital Structure
EV/EBITDA values a firm on operating profit before interest, tax, depreciation. Formula, sector typical bands, when it beats P/E, and the pitfalls.
Read post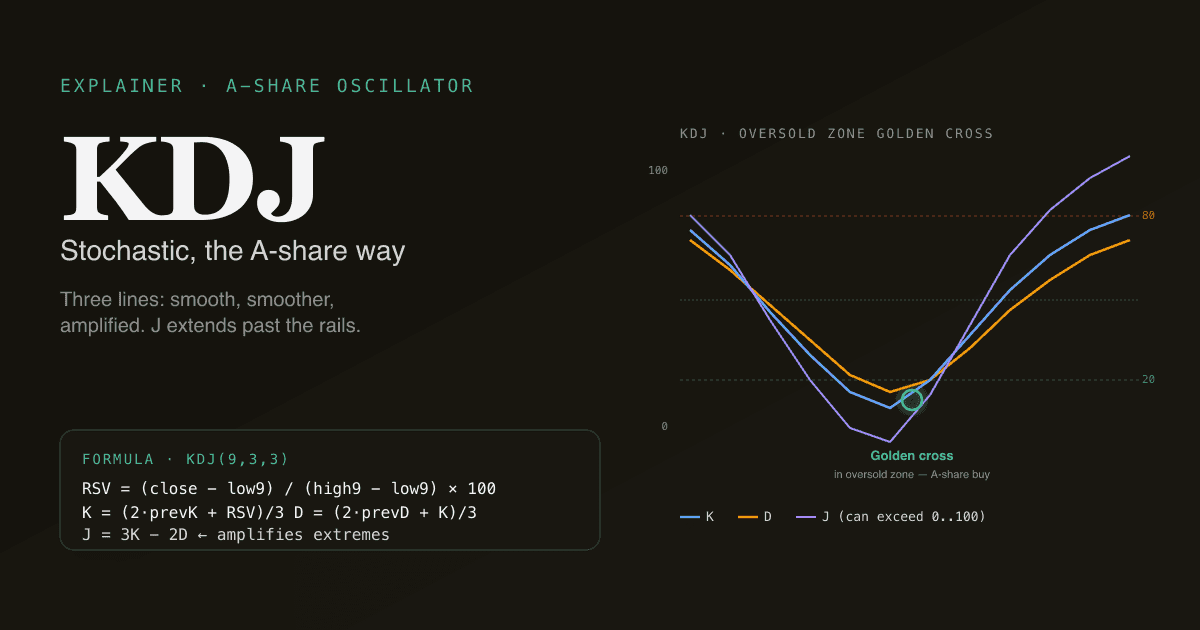 ExplainerMay 23, 2026 · 9 min
What Is KDJ? The A-Share Stochastic, Explained Globally
KDJ uses a 9-day high-low range smoothed into K, D, and an amplified J line. The A-share standard oscillator — formula, signals, FAQ.
Read post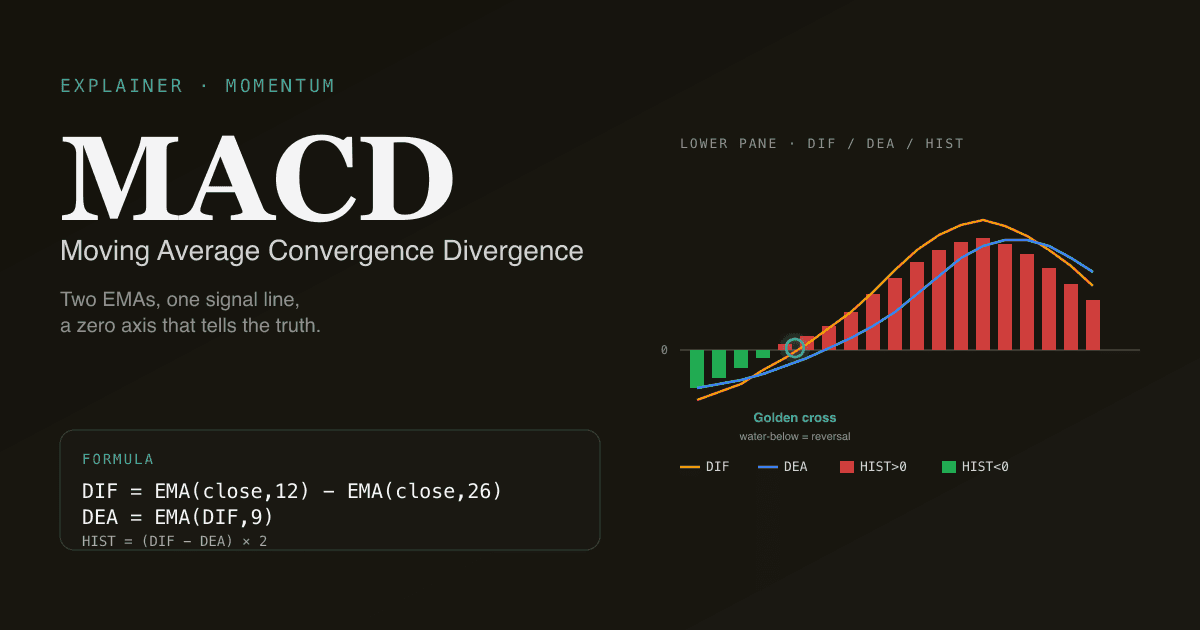 ExplainerMay 23, 2026 · 8 min
What Is MACD? A Practical Guide to the Indicator
MACD = EMA(12) − EMA(26), smoothed by EMA(9). Formula, the truth about water-above vs water-below crosses, and 4 retail pitfalls.
Read post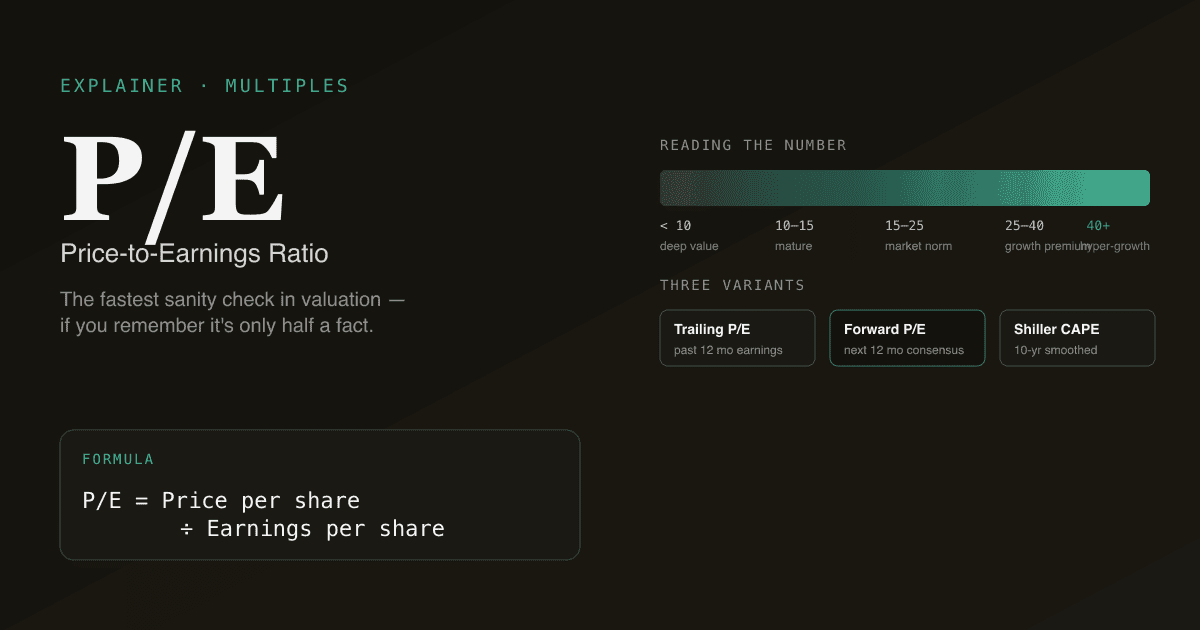 ExplainerMay 23, 2026 · 8 min
What Is the P/E Ratio? Trailing, Forward, and Shiller Variants
P/E = price / earnings per share. The trailing, forward, and Shiller forms; the 4 traps that bend comparisons; and how to anchor against peers.
Read post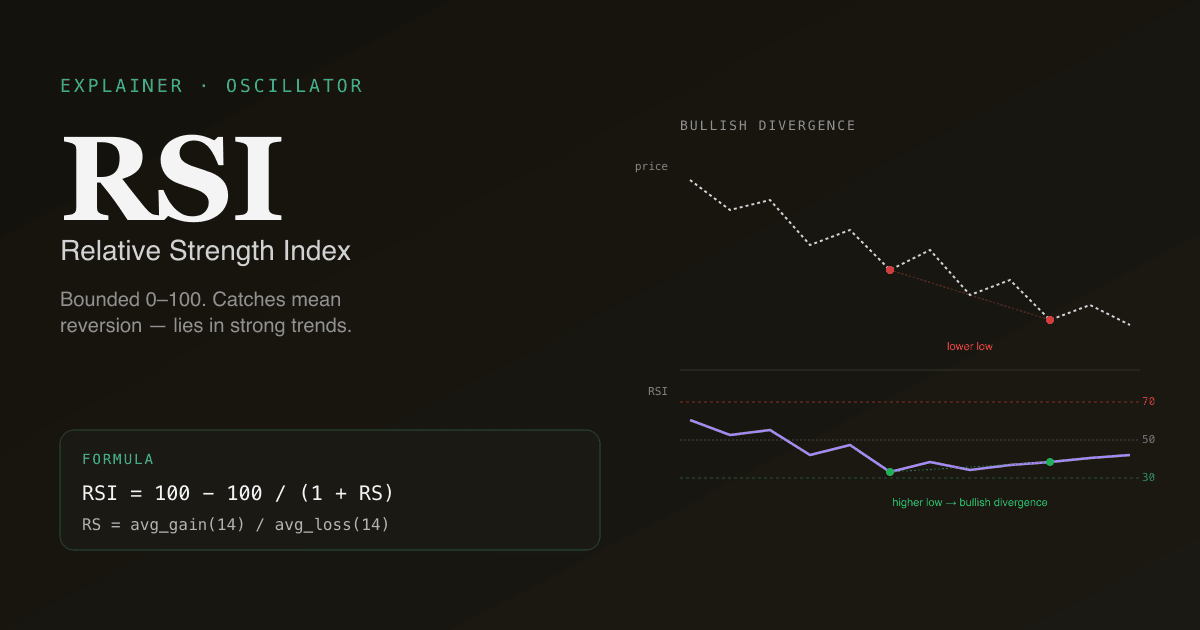 ExplainerMay 23, 2026 · 8 min
What Is RSI? The Oscillator That Lies in Strong Trends
RSI is a 14-period oscillator on a 0–100 scale. Formula, why 70/30 fail in trends, and the divergence patterns that actually predict reversal.
Read post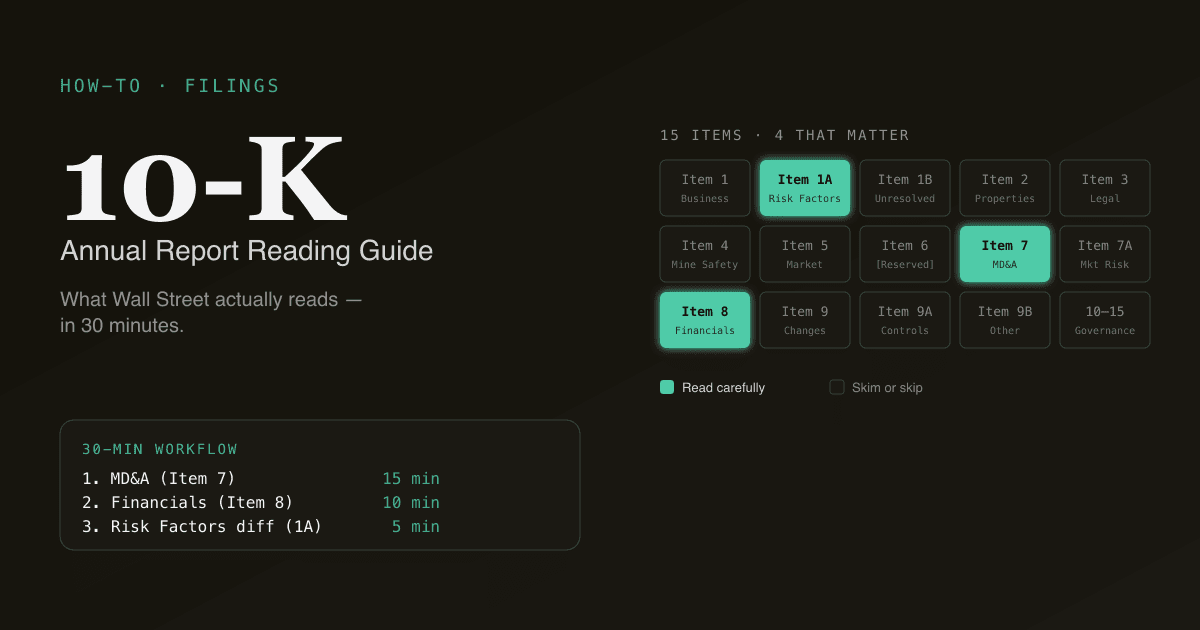 How-toMay 22, 2026 · 10 min
How to Read a 10-K in 30 Minutes — What Wall Street Actually Reads
What Wall Street actually reads in an SEC 10-K. The 4 Items (of 15) that carry signal, a 30-minute reading workflow, and the year-over-year diff technique.
Read post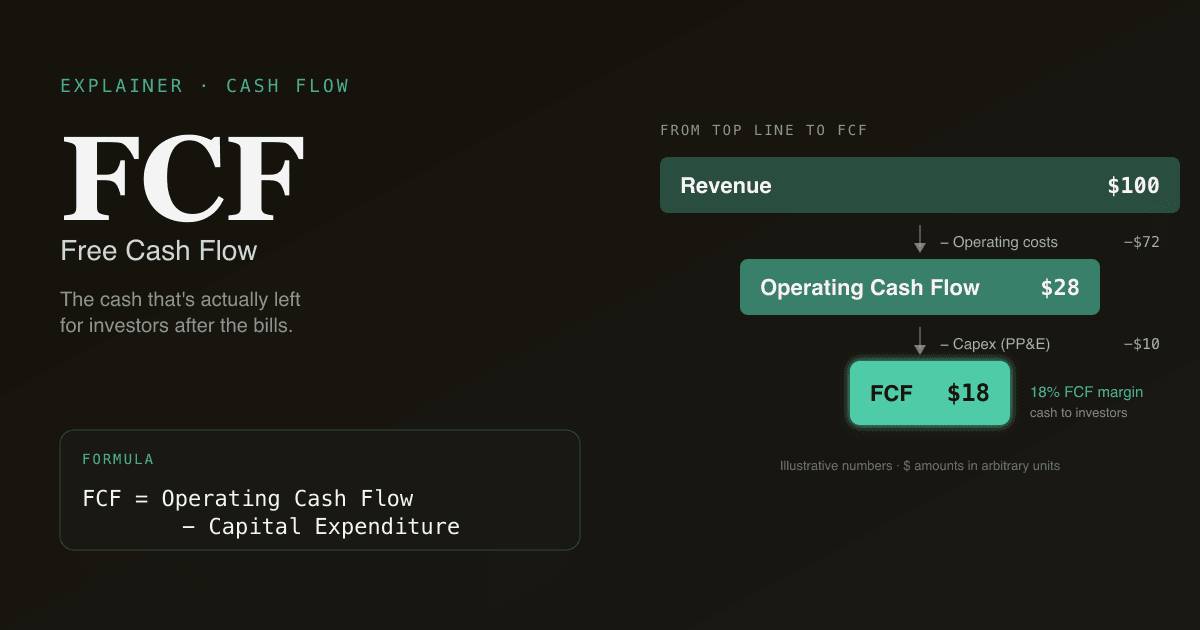 ExplainerMay 22, 2026 · 10 min
What Is Free Cash Flow (FCF)? The Number Behind Every Honest Valuation
FCF is the number behind every honest valuation. FCFF vs FCFE, how to compute from a cash flow statement in 60 seconds, and four tech-company pitfalls.
Read post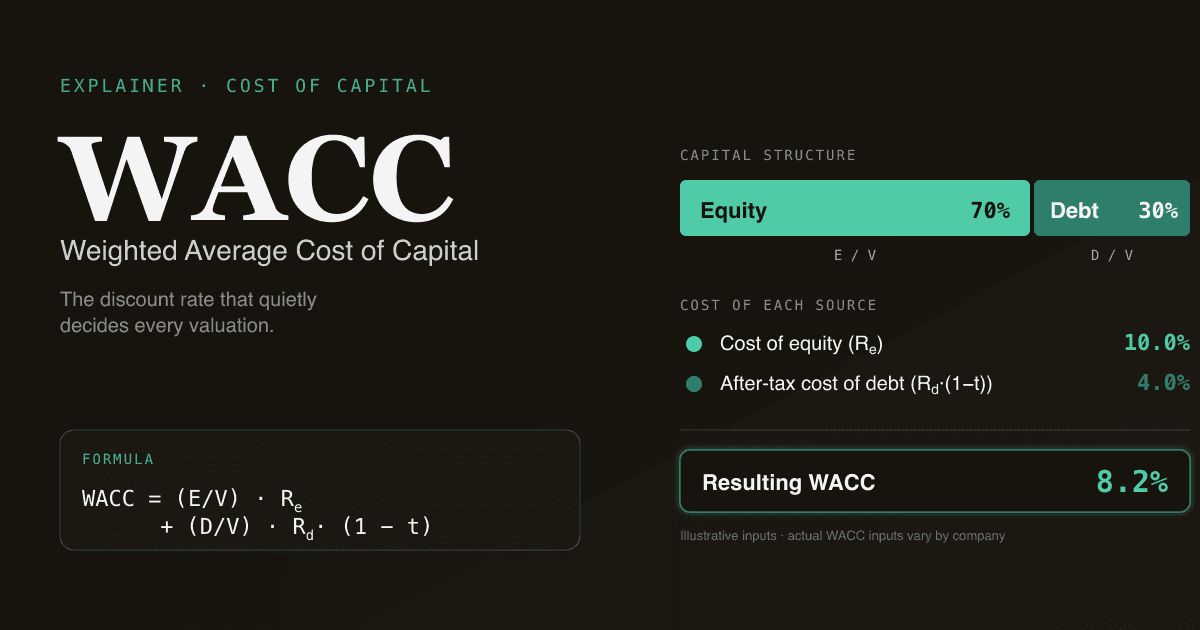 ExplainerMay 22, 2026 · 10 min
What Is WACC? The Discount Rate That Quietly Decides Every Valuation
WACC is the discount rate that decides every DCF. Formula, the four inputs that matter, why 100bp changes valuation 8-15%, and triangulation workflow.
Read post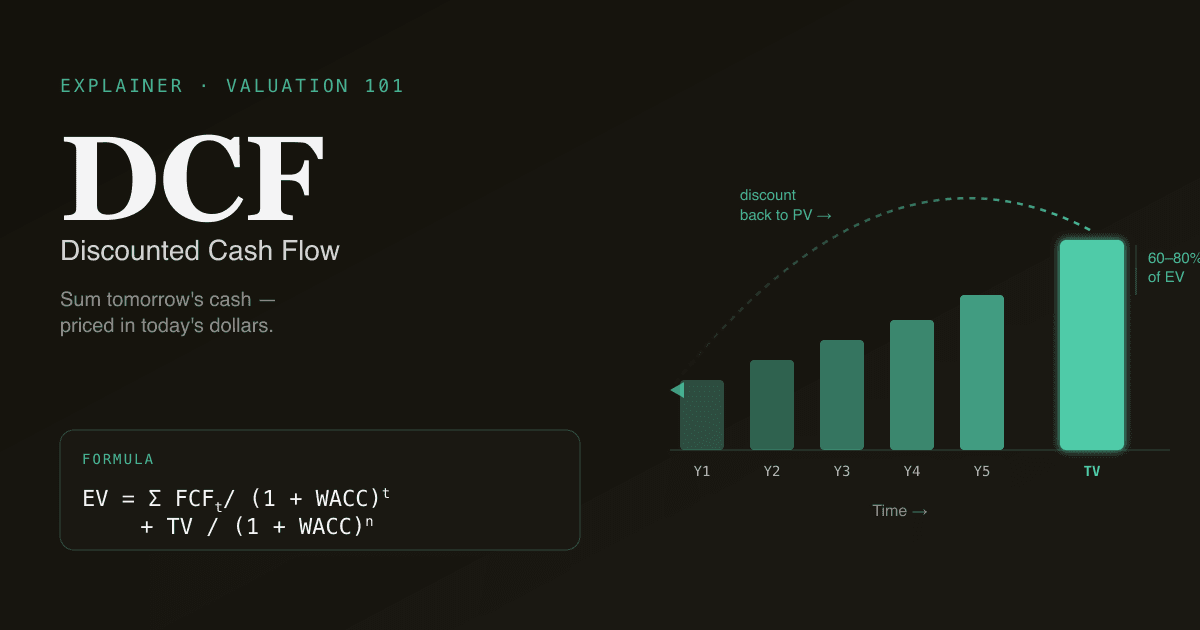 ExplainerMay 21, 2026 · 8 min
What Is DCF? A Practical Guide to Discounted Cash Flow
A practical 2026 guide to DCF — the formula, four assumptions that move valuation, common pitfalls, and how to model one in under an hour.
Read post