KDJ vs RSI — Which Momentum Oscillator Should You Use?
KDJ and RSI both measure momentum, but on different formulas and timeframes. Side-by-side comparison, when each one wins, and how to combine them.
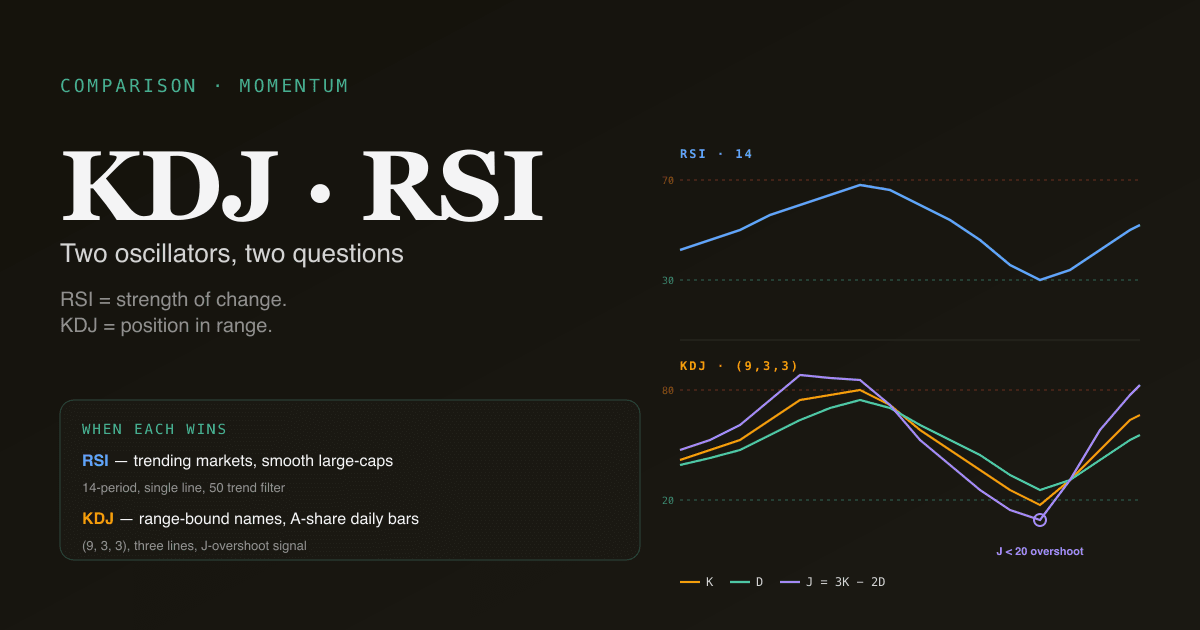
RSI and KDJ are both momentum oscillators, but they ask different questions. RSI measures the strength of recent price changes against their average size; KDJ measures where the close sits within the recent price range and then smooths that signal twice. Most retail debates frame them as substitutes. They are complements — each has a distinct edge in a specific market regime, and the combination is more informative than either alone.
Key takeaways
- Different inputs: RSI uses close-to-close changes; KDJ uses close-vs-range position.
- Different scales: RSI runs 0–100 with overbought / oversold at 70 / 30; KDJ's J line can exceed 0–100 (and that overshoot is informational).
- RSI excels in trending markets — its 50-line is a clean trend filter.
- KDJ excels in range-bound markets — its sensitivity to range position makes it earlier on reversals at swing levels.
- The combination is more powerful than either alone — divergence in both simultaneously is materially higher-conviction than divergence in one. The PickSkill /indicators dashboard runs both side-by-side on every holding.
The two formulas, side by side
RSI (Relative Strength Index)
Developed by J. Welles Wilder in 1978. Range 0–100; default 14 periods.
RS = Average Gain(14) / Average Loss(14)
RSI = 100 − [100 / (1 + RS)]
The "average gain" is the mean of bars where close rose; "average loss" is the absolute mean of bars where close fell. The smoothing uses Wilder's modified moving average (a 14-period exponential smoothing with α = 1/14), which differs slightly from a standard EMA.
For a deeper treatment see What Is RSI?.
KDJ (Stochastic Oscillator with a J line)
A variant of the classic stochastic oscillator with an added J line. Most widely used in the Chinese A-share retail community; default (9, 3, 3) periods.
RSV = ((Close − Low(9)) / (High(9) − Low(9))) × 100
K = (2/3 × K[prev]) + (1/3 × RSV)
D = (2/3 × D[prev]) + (1/3 × K)
J = 3 × K − 2 × D
K and D run 0–100; J can exceed both ends (J > 100 or J < 0) because of its construction. The overshoot is the J line's distinguishing feature — it amplifies extremes and turns earlier than K or D.
For a deeper treatment see What Is KDJ?.
Where they differ in interpretation
| Aspect | RSI | KDJ |
|---|---|---|
| Underlying input | Close-to-close price changes | Close vs recent high-low range |
| Default period | 14 | 9 (faster) |
| Overbought / oversold | 70 / 30 | 80 / 20 (K, D); J overshoots |
| Number of lines | 1 line | 3 lines (K, D, J) |
| Best at detecting | Trend strength + extremes | Reversal in a defined range |
| Cross signals | RSI crossing 50 (trend filter); 70 / 30 exits (extreme exits) | K crossing D (faster); J turning points (fastest) |
| Failure mode | Stays overbought / oversold during strong trends | Whipsaws in low-volatility chop |
| Most cultural in | US institutional + retail | A-share retail; some HK adoption |
The fundamental difference: RSI is a change-of-price indicator; KDJ is a range-position indicator. In a trending market, RSI's "strength of change" reading is informative — strong upward closes drive RSI toward 70 and keep it there. In a range-bound market, KDJ's "position in range" reading is informative — when close is near the range high, KDJ is near 80 regardless of how strong the change was.
When does RSI win?
Three regimes where RSI delivers more signal than KDJ:
- Confirmed trending markets. When ADX > 25, RSI's overbought / oversold readings stay reliable as continuation signals rather than reversal signals. A persistent RSI > 70 in a trending market is not "overbought to sell" — it is "uptrend with momentum." RSI's 50-line acts as a clean trend filter: above 50 = uptrend bias, below = downtrend.
- High-momentum names with smooth trends. Large-cap tech, mega-cap names, indices — instruments with sustained directional moves and limited mean reversion. RSI captures the persistence of momentum better than KDJ, which oscillates too much.
- Multi-timeframe analysis. Because RSI is a single line, multi-timeframe comparison (daily RSI alignment with weekly RSI) is cleaner. KDJ's three lines make multi-timeframe analysis cluttered.
For a deep dive on RSI specifically, see What Is RSI?.
When does KDJ win?
Three regimes where KDJ delivers more signal than RSI:
- Range-bound markets at swing levels. When price oscillates in a defined range (support and resistance both well-defined), KDJ's earlier and more sensitive turns catch the reversals at both ends of the range while RSI is still neutral.
- A-share daily bars. A-share retail community uses KDJ as the default momentum tool; the cultural coordination means the signals are partially self-fulfilling on A-share names. The J-line overshoot pattern is a recognised setup in local trader vocabulary.
- Catching the bottom (or top) of fast moves. KDJ's three-line construction means J turns first, then K crosses D for confirmation. Two-stage confirmation is faster than RSI's single-line trajectory and works well on stocks with sharp swing pivots.
For a deep dive on KDJ specifically, see What Is KDJ?.
How to use them together
The cleanest combination — used in the PickSkill multi-indicator dashboards — runs both in parallel and looks for agreement:
| Signal | Interpretation |
|---|---|
| RSI oversold + KDJ oversold + both turning up | High-conviction bullish reversal candidate; the two oscillators agree on both the condition and the turn |
| RSI > 70 + KDJ > 80 + price still trending up | Continuation in confirmed uptrend; do not fade unless ADX shows weakening trend |
| RSI divergence + KDJ divergence on same swing | Multi-oscillator divergence — materially higher-edge than divergence in one alone |
| RSI says one thing, KDJ says another | Conflicting signal — skip the setup until alignment emerges |
The discipline is to require both. Acting on RSI alone (or KDJ alone) is acting on one input; requiring agreement filters out a substantial share of false positives.
Four pitfalls in the RSI / KDJ comparison
- Treating either as a standalone trigger. Both oscillators are filters and confirmations, not standalone triggers. Pair them with a trend filter (MA stack + ADX) and a level reference (support / resistance) before acting.
- Using default periods on every instrument. The defaults (RSI 14, KDJ (9, 3, 3)) are reasonable starting points on daily bars. On weekly bars they translate to ~3 months and ~9 weeks — different in real-world terms. On intraday bars they capture far less information than retail guides assume. Match the period to the timeframe you actually trade.
- Ignoring the cultural context. US institutional flow trades on RSI; A-share retail flow trades on KDJ. The cultural coordination matters because it makes signals partially self-fulfilling. On A-share names, KDJ has additional informational weight beyond its mathematical content.
- Trying to determine which one is "better." Both work; both have specific failure modes; both are stronger together. The "RSI vs KDJ" debate is a category error — they are complementary tools, not competitors.
How they behave on A-shares vs US stocks
A-share market microstructure changes which one to lean on:
- A-shares: KDJ is the default. Daily limits, T+1 settlement, and higher retail participation all favour the range-position framing over the change-strength framing. RSI still works but is culturally secondary. The PickSkill dashboards surface both with KDJ as the primary indicator on A-share charts.
- US large-caps: RSI is the default. Continuous liquidity, deep institutional flow, and smoother price action favour RSI's trend-strength framing. KDJ still works but signals more frequently — many of them false positives in trending markets.
- HK names: Mixed culture — local trader vocabulary uses KDJ; foreign institutional flow uses RSI. Either works; using both is the conservative default.
See MACD on A-Shares vs US Stocks for the broader market-by-market analysis and Best Indicators for A-shares for the A-share playbook.
Run both on your portfolio. The /indicators dashboard renders RSI and KDJ side-by-side for every holding, surfaces agreement / disagreement at a glance, and flags multi-oscillator divergence as a separate signal.
Further reading
- Investopedia on RSI and stochastic oscillator (KDJ family) — reference treatments.
- J. Welles Wilder Jr., New Concepts in Technical Trading Systems — the developer's original RSI reference.
FAQ
Which one should a beginner start with? RSI. The 0–100 scale is intuitive, the single line is easier to read, and the 50 / 30 / 70 thresholds are widely known. KDJ adds power but also complexity; start with RSI, add KDJ once you have internalised the basics of momentum oscillators.
Are KDJ and stochastic the same thing?
KDJ is a variant of stochastic. Standard stochastic plots K and D only; KDJ adds the J line (J = 3K − 2D). The K and D math is identical between the two. The J line is the only addition, and it is the most A-share-specific element.
Can I use them on intraday timeframes? You can, but reduce expectations. On 5-minute or 15-minute charts both oscillators generate dozens of signals per session, most of them noise. Use intraday-style parameter tuning (RSI 8 or 9 periods, KDJ (5, 3, 3)) and require multi-signal confirmation. Most retail intraday work overuses these oscillators relative to their actual edge.
What is the J line overshoot in KDJ, and is it the same as RSI > 70?
The J line is constructed as 3K − 2D, which means it can exceed the 0–100 range that bounds K and D. A J > 100 or J < 0 reading is a "deep extreme" — more extreme than what either K, D, or RSI would show. It often precedes the actual turn by 1–3 bars. RSI does not have this overshoot property; RSI is bounded 0–100 by construction. The J overshoot is one of KDJ's edges.
Why does my chart show different RSI / KDJ values than another platform? RSI: Wilder's smoothing vs standard EMA smoothing produces small differences. KDJ: different starting values for the recursive K and D smoothing produce different early-period readings (the difference washes out after ~30 bars). For consistency, the PickSkill dashboards use Wilder smoothing for RSI and 2/3-prior + 1/3-current weighting for KDJ — the conventions used in academic backtests and the most widely deployed retail platforms.