What Are Support and Resistance? The Levels That Actually Matter
Support and resistance are price levels where reversals cluster. How to identify them objectively, why round numbers and prior highs work, and four pitfalls.
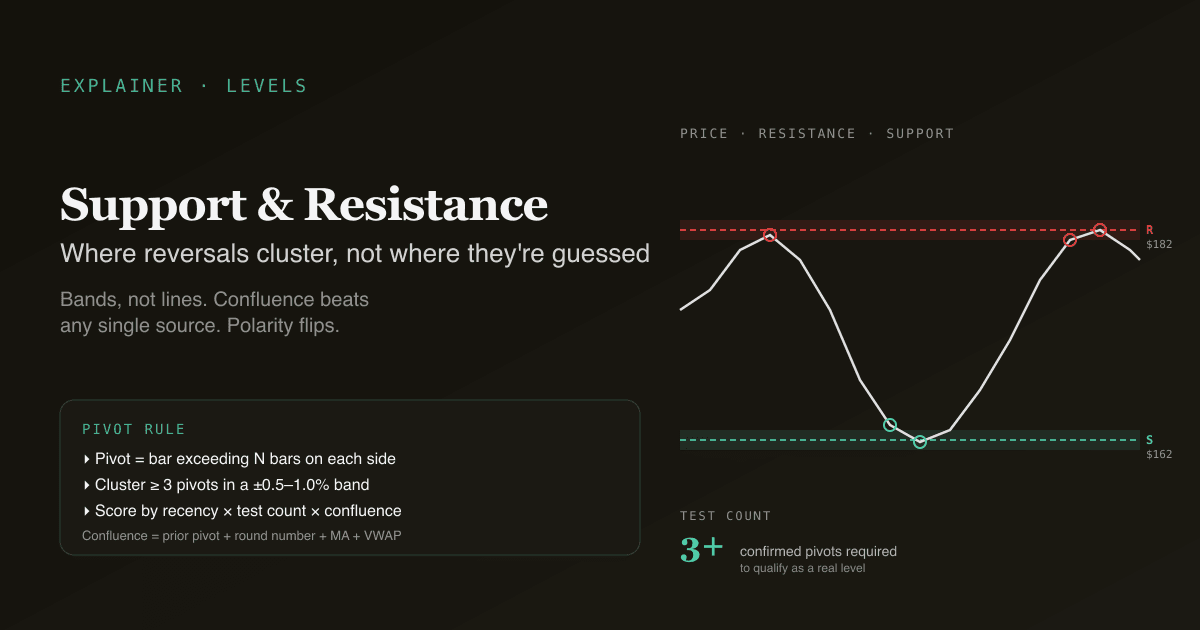
Support is a price level where buying pressure has repeatedly absorbed selling — preventing a further decline. Resistance is the mirror: a price level where selling has repeatedly capped advances. They are not lines drawn from intuition; they are statistical clusters of reversal pivots that, once identified, become reference points the market itself acts on. The reason they "work" is reflexive — enough traders watch the same level that the level becomes self-reinforcing.
Key takeaways
- A level becomes support / resistance when at least 2–3 confirmed reversal pivots cluster within a tight band — not when a single bar happens to bounce.
- The strongest levels combine multiple sources: a prior swing high plus a round number plus a major moving average is materially stronger than any one of those alone.
- Levels degrade with each test. Each subsequent touch of a level draws on the absorbing capacity sitting there; by the third or fourth test the level is usually weaker, not stronger.
- Broken support becomes resistance (and vice versa) — the classic "polarity flip." This is the most reliable single observation in level-based technical analysis.
- Renders on the /indicators support / resistance dashboard for every holding, with the level history and recent test count surfaced explicitly.
How are support and resistance identified objectively?
The casual approach is "draw a horizontal line where it looks like price has bounced." That works on the eyes but does not generalise. The objective approach uses confirmed swing pivots clustered within a band:
- Find swing pivots. A swing high is a bar whose high exceeds the high of the N bars on either side; a swing low is the mirror. Common N values are 3, 5, or 7 on daily bars — the choice trades off sensitivity (smaller N = more pivots = more noise) against signal (larger N = fewer pivots = stronger ones).
- Cluster pivots within a band. Pivots that fall within a tight price band (e.g. ±0.5% on a $100 stock, or ±1 ATR for adaptive sizing) form a candidate level.
- Require multiple confirmations. A candidate level needs at least 2–3 pivots inside the band to qualify as a real level. One bounce is just one bounce.
- Score by age and frequency. Recent pivots carry more weight than year-old ones; bands with more pivots inside them carry more weight than bands with just the minimum.
The PickSkill support / resistance dashboard runs this exact algorithm on every holding, scoring candidate levels by recency × count and rendering only the top-N strongest per ticker. The result is a small set of high-conviction levels rather than a chart cluttered with every minor bounce.
What sources make a level "strong"?
The strongest levels are not any single source — they are confluence:
| Source | What it adds |
|---|---|
| Prior swing high / low | Direct evidence the market has reversed there before |
| Round number ($100, $50, $10) | Psychological round-number magnetism; many limit orders cluster here |
| Major moving average (50-day, 200-day SMA) | Systematic risk-on / risk-off triggers run off these |
| Fibonacci retracement levels | Less objectively grounded but widely watched, so partially self-fulfilling |
| VWAP / volume-weighted average price | Reference price institutions transact against |
| Prior consolidation range edges | Boundaries of a range where many participants traded |
A level that combines three or four sources (e.g. a prior swing high at $100.40 that is also the 200-day SMA at $100.55 with a round number at $100) is much stronger than any single-source level. The PickSkill dashboard flags confluence levels — those backed by multiple independent sources — with a separate marker.
Why do levels work at all?
Three reinforcing mechanisms:
- Order-book memory. Limit orders sitting at round numbers and prior reversal points accumulate over time. When price reaches the level, those orders absorb flow.
- Behavioural anchoring. Traders who bought at a prior low anchor their pain at that level; if price retests it from below, the prior buyers who got out at break-even become a wall of sellers. This is "broken support becomes resistance."
- Self-fulfilling coordination. Because most market participants use similar tools to identify the same levels, they trade against the levels in similar ways. The coordination produces real bounces at the level, which validates the use of levels, which reinforces the coordination loop.
None of these mechanisms are magical. They explain why levels are real signals while also explaining why levels eventually break — when fundamental conditions change enough that the order book and behavioural anchors no longer dominate, levels give way.
What does it mean when a level breaks?
A "break" is when price closes meaningfully through a level on volume — not just an intraday wick. Two patterns dominate post-break behaviour:
- Continuation. Price breaks through and keeps going. The level was the last meaningful obstacle; once cleared, the next move targets the next level above (resistance broken) or below (support broken).
- Polarity flip (broken support becomes resistance). Price breaks below support, drops, then rallies back to retest the broken level — which now acts as resistance. This is the most reliable single pattern in level-based analysis. It works because the order-book composition has flipped: the people who bought at the level are now sitting on losses and want out at break-even; the people who shorted the break want to add at higher prices. Both forces sell into the retest.
Polarity flips have higher reliability than the initial break itself, which is why "wait for the retest" is one of the few pieces of price-action advice with consistent empirical support across markets.
Four pitfalls in using support and resistance
- Drawing lines, not zones. Support is not a price — it is a band. Treating a single price (e.g. $100.00) as a hard level invites stop-running and false breakouts. Use a band of ±0.5–1.0% (or ±0.5 ATR for volatile names).
- Counting too many levels. A chart with 12 horizontal lines is no different from a chart with no lines — none of them are operating as references. Restrict to 2–4 strong levels per timeframe; if your chart needs more, the levels are too weak.
- Ignoring level degradation. Each test of a level consumes some of the absorbing capacity. By the third or fourth test, the probability of a clean break rises sharply — paradoxically, the "more tested" a level is, the more fragile it becomes near the end. Treat repeated tests as a warning, not a confirmation.
- Trading the level as a binary trigger. "Buy at support" without confirmation (volume, RSI oversold, candlestick pattern at the level) is buying into falling knives roughly half the time. Wait for at least one confirming signal at the level — that single filter cuts the false-positive rate substantially.
How levels behave on A-shares
The mechanics are universal; the microstructure adjusts the application:
- Price-limit days create artificial levels. A limit-up close at the limit price is not a real "high" — it is an arbitrary cap imposed by the exchange. Treating limit-up closes as resistance levels overstates the case. The PickSkill dashboard excludes limit-day pivots from level construction.
- Round-number psychology is stronger. A-share retail community is more attentive to round-number levels than US institutional flow. ¥10, ¥100, and key index levels (e.g. 3000 on the Shanghai Composite) act as stronger psychological anchors than equivalent US levels.
- Volume confirmation matters more. A-share volumes are highly bimodal — quiet days vs hot days. Level breaks on quiet-day volume often fail; level breaks on hot-day volume (3×+ the 20-day average) tend to follow through.
See Best Indicators for A-shares for the broader market-by-market view.
See it on your holdings. The /indicators support / resistance dashboard renders the top levels for every position, scored by recency and confluence, with the recent test history visible.
How support / resistance fits in a multi-signal workflow
Levels are the map; oscillators and trends are the terrain. The combination:
| Layer | Tool | Question answered |
|---|---|---|
| Map | Support / resistance levels | Where are the meaningful price points? |
| Trend | 50/200 MA + ADX | In which direction is the market biased? |
| Momentum | MACD, RSI | Is the move at the level supported by momentum? |
| Volatility | Bollinger Bands | Is the move at the level proportionate or extreme? |
A bullish setup with all four aligned (price at confluence support, in a confirmed uptrend, with RSI oversold and a Bollinger lower-band touch) is materially higher-edge than any one layer alone. Skip layers and the level alone is closer to a coin flip.
Further reading
- Investopedia on support and resistance — comprehensive reference covering all the standard patterns.
- Al Brooks, Price Action Trading — practitioner's treatment of how levels interact with bar-by-bar context.
FAQ
How do I know which support level is the most important? Score by three factors: (1) recency — how recently the level was last respected, (2) test count — how many confirmed pivots cluster at the level, and (3) confluence — how many independent sources (prior swing, round number, moving average, VWAP) align at the level. A level with all three (recent, 3+ tests, multi-source confluence) is the highest-conviction; a level with one is much weaker. The PickSkill dashboard scores levels on these factors and renders only the top-N per ticker.
Is a round number always support / resistance? On its own, no — round numbers are only weakly self-fulfilling. They become meaningful support / resistance when they coincide with a structural pivot (a prior high or low formed near the round number) or a major moving average. A round number floating in space with no nearby pivots is just a number.
What is the difference between support / resistance and a moving average? A moving average is a continuous reference line that updates every bar; support / resistance levels are static horizontal lines from past pivots. Both are reference points, but they answer different questions. Moving averages tell you "what is the recent typical price?" — support / resistance tells you "where has the market historically reversed?" The strongest signals come when both align at the same price.
Why does broken support become resistance? Three forces all push the same direction. (1) Traders who bought at the level are now under water; many will sell at break-even on the retest, providing supply. (2) Traders who shorted the break are watching for a rally to add to their position. (3) Algorithmic systems are programmed to scale into the move when a level flips. All three are sellers at the retest, which is why the retest tends to fail and the polarity flip works.
Can I trade support / resistance on intraday charts? You can, but the level identification becomes noisier as bar size shrinks. On 5-minute charts every micro-pivot looks like a level; almost none of them have the confluence required to be real. If trading intraday, use higher-timeframe levels (daily, weekly) as the reference and the intraday bars only for timing entries. The PickSkill dashboards currently render daily-bar levels only — these are the levels institutions actually trade off.