SMA vs EMA — Which Moving Average Should You Use?
SMA weighs every bar equally; EMA weighs recent bars more. Side-by-side comparison, when each one wins, and why the 200-day SMA matters more than its EMA cousin.
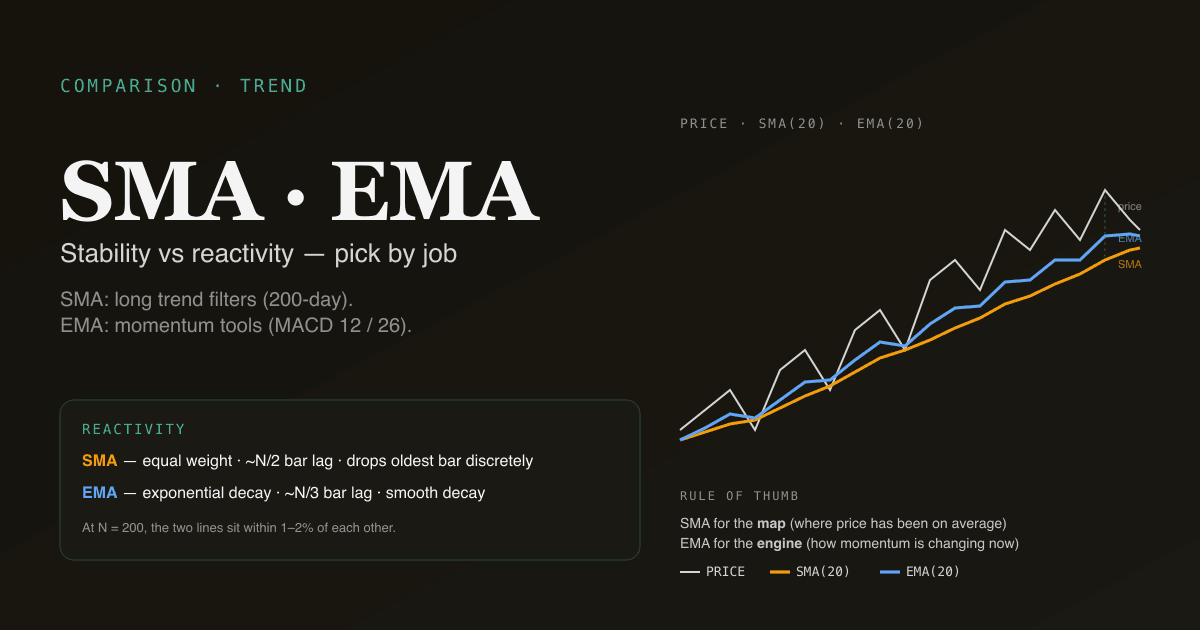
SMA (simple moving average) is the arithmetic mean of close price over N bars — every bar weighted equally. EMA (exponential moving average) applies an exponentially decaying weight, so recent bars matter more. The mathematical difference is small. The practical difference — which one reacts faster, which one is more stable, and which one institutions coordinate around — drives most of the editorial choice. There are right and wrong answers depending on what you are trying to do.
Key takeaways
- SMA reacts slower; EMA reacts faster. That single property explains 80% of when to use each.
- EMA is the right choice inside momentum tools (MACD uses EMA(12) and EMA(26)) — reactivity matters in those contexts.
- SMA is the right choice for trend filters. The 200-day SMA is the institutional reference; the 200-day EMA exists but barely anyone watches it.
- The gap shrinks as the window grows. At 200 bars, SMA and EMA values typically sit within 1–2% of each other.
- Both render on the PickSkill /indicators dashboards — the MA cards default to SMA for the 200-day, EMA for the 12 / 26 inside MACD, and SMA for the 20 / 60 stack.
The two formulas, side by side
Simple Moving Average (SMA)
SMA(N) = (close[t] + close[t-1] + ... + close[t-N+1]) / N
Every bar in the window gets weight 1/N. On day t+1 the oldest bar drops out and the new bar comes in. Each bar's influence is binary: it is in the window or it is not.
Exponential Moving Average (EMA)
EMA(N)[t] = α × close[t] + (1 − α) × EMA(N)[t−1]
            where α = 2 / (N + 1)
Today's close gets weight α; yesterday's EMA carries the rest. The recursive form means every prior bar contributes, with weight decaying exponentially. For N = 20, the most recent bar gets ~9.5% weight; the bar 10 days ago gets ~3.7%; the bar 50 days ago gets ~0.4%.
For a more thorough treatment of both, see What Is a Moving Average?.
Side-by-side comparison
| Property | SMA | EMA |
|---|---|---|
| Weighting | Equal across the window | Exponentially decaying |
| Lag | High — full N/2 bar lag on trending data | Lower — ~N/3 bar effective lag |
| Reaction to recent prices | Slower | Faster |
| Effect of outlier bars | Single outlier biases the SMA for exactly N bars, then drops | Outlier influence decays smoothly forever |
| Behaviour on edge of window | Sharp drop when old bar leaves the window (the "drop-off effect") | Smooth — no discrete drop-offs |
| Most-used default for | Trend filters (200-day), Bollinger middle band | Momentum tools (MACD 12 / 26) |
| Institutional coordination | High — 200-day SMA is the universal reference | Lower — only inside specific tools |
| Computational cost | Higher (window sum each bar) | Lower (one multiply and add) |
The drop-off effect is worth pausing on. Imagine a 20-day SMA where 20 bars ago the close was $80 and today the same stock is $100. When tomorrow rolls in and the $80 bar drops out of the window, the SMA jumps even if today's close is flat — because the average dropped a low number from the calculation. The SMA can shift discretely without any new information. EMA does not have this artifact; the influence of the $80 bar decays continuously and smoothly.
Which one reacts faster?
EMA reacts faster — by construction. For the same period N, EMA's effective lag is approximately N/3 bars while SMA's is N/2 bars.
On a sharp price move, EMA will turn 1–3 bars earlier than SMA of the same length on daily charts. On a sustained trend, EMA tracks closer to current price while SMA tracks the middle of the trend. On a slow grind, the difference is small.
The faster reaction is the entire reason EMA exists. It is also why EMA produces more false signals — every additional sensitivity comes with additional noise. The reactivity-vs-stability trade-off is the design choice each tool's developer made:
- MACD uses EMA because momentum tools need reactivity.
- The 200-day SMA endures because the institutional risk filter wants stability.
- The Bollinger middle band is SMA(20) because the bands' statistical interpretation (standard deviation envelope) is cleanest around a simple mean.
When does SMA win?
Three contexts where SMA's stability advantage matters:
- Long-window trend filters. The 200-day SMA is the universal reference for trend regime — institutional coordination at this specific level is the entire point. Switching to a 200-day EMA discards the coordination advantage with no real informational gain. Stick to SMA.
- Statistical envelope construction. Bollinger Bands use SMA(20) as the middle band because the ±2 standard-deviation envelope has a clean statistical interpretation around an arithmetic mean. Around an EMA the interpretation gets muddier.
- Outlier robustness in low-liquidity names. A thin-traded small-cap with one earnings-gap day will see its EMA biased for weeks afterward (because outlier influence never fully decays in EMA). The SMA drops the outlier completely after N bars — cleaner behaviour for low-liquidity instruments.
When does EMA win?
Three contexts where EMA's reactivity advantage matters:
- Inside momentum tools. MACD (EMA(12) − EMA(26), smoothed by EMA(9)) is the classic example. The whole point of MACD is to capture momentum changes; SMA's lag would render the cross signals too late to be useful.
- Short-window swing systems. Active traders running short-window MA cross systems (5/10, 10/20) typically prefer EMA — the faster turns capture swing pivots that SMA misses.
- High-frequency tracking of fast-moving stocks. For a stock making rapid directional moves (parabolic uptrends, sharp reversals), EMA's continuous decay produces smoother tracking than SMA's discrete drop-offs.
What about WMA, HMA, and other variants?
Beyond SMA and EMA, dozens of moving-average variants exist:
| Variant | Weighting scheme | Note |
|---|---|---|
| WMA (Weighted MA) | Linear decay across N bars | Between SMA and EMA in reactivity |
| HMA (Hull MA) | Adaptive — combines weighted MAs at different lengths | Very low lag; popular with active traders, less culturally embedded |
| TEMA / DEMA | Triple / double exponentially smoothed | Designed to reduce EMA lag further; modest improvement |
| VWMA (Volume-Weighted MA) | Weight each bar by its volume | Incorporates participation; useful for low-liquidity names |
| KAMA (Kaufman Adaptive MA) | Length adapts to market volatility | Smoothest in chop, fastest in trends; mathematically elegant, modest practical edge |
For most retail use cases, SMA and EMA cover the field. The exotic variants offer marginal improvements in specific scenarios but trade off institutional coordination (nobody else is watching your KAMA line) for theoretical edge. Stick to SMA and EMA unless you have specific backtest evidence justifying a variant.
Four pitfalls in choosing between SMA and EMA
- Mixing the two in a single signal without thinking. A "20-day EMA crossing 50-day SMA" is a mathematically valid signal — but the comparison is apples-to-oranges (different lag characteristics) and the result is harder to interpret. Pick one family and stay consistent within a system.
- Switching to EMA because backtests look better. EMA's faster reactivity produces more signals; some of those extra signals are correct (and lift the equity curve) and some are false (and add drawdowns). Backtest-tuning typically discovers EMA on data that happens to favour reactivity over stability. Out-of-sample, the effect is often gone.
- Treating EMA's "no drop-off" property as universally better. The drop-off effect is sometimes informational — a sharp SMA shift when an old outlier leaves the window is telling you the recent price action is meaningfully different from N bars ago. EMA hides that information in its smoothness.
- Using EMA for the 200-day trend filter. This is the most common mistake. The 200-day SMA matters because everyone watches it; the 200-day EMA is just a slightly faster line with no institutional coordination behind it. Switching loses the coordination benefit and gains nothing meaningful.
How they behave on A-shares vs US stocks
The market microstructure changes the calculus subtly:
- A-shares: limit-up and limit-down days are functional outliers. SMA's "drop the bar after N bars" property handles them cleanly; EMA's continuous decay means a limit-up day biases the EMA for weeks. For A-share names with frequent limit days, SMA is more robust.
- US large-caps: continuous liquidity means outlier days are rare; the EMA-vs-SMA difference is smaller in practice. Either works; choose based on the specific tool (EMA for momentum, SMA for trend filters).
- HK names: mixed convention; local platforms often default to SMA, foreign brokers often default to EMA. Either is acceptable.
The PickSkill dashboards default to SMA for long-window trend filters (50, 60, 200) and EMA for short-window momentum tools (12, 26 inside MACD). This is the convention used in the broadest range of academic backtests and matches the institutional reference.
See both on your charts. The /indicators page renders the standard MA stack — 20 / 60 / 200 (SMA) plus MACD's internal 12 / 26 EMAs — across every holding, with the cross status and slope direction flagged.
How the choice plays out in a real workflow
The cleanest mental model: use SMA for the map (where price has been on average over the window), use EMA for the engine (how momentum is changing right now).
| Workflow stage | Tool | MA flavour |
|---|---|---|
| Trend regime | 200-day MA | SMA |
| Medium-term context | 50-day MA | SMA |
| Short-term context | 20-day MA | SMA |
| Momentum oscillator | MACD | EMA (internal) |
| Volatility envelope | Bollinger middle | SMA |
| Swing-trade entry filter | 5/10 cross system | EMA |
Use both, but use each in the right place.
Further reading
- Investopedia comparison of SMA and EMA — concise reference for the mechanical differences.
- Robert Colby, The Encyclopedia of Technical Market Indicators — exhaustive treatment of moving-average variants with historical backtests.
FAQ
Should I always use EMA because it reacts faster? No. Faster reaction means both more correct signals and more false signals. For long-window trend filters, SMA's stability is the point. For short-window momentum tools, EMA's reactivity is the point. Pick the right one for the job, do not optimise everything for speed.
Why is the 200-day SMA more famous than the 200-day EMA? Decades of institutional convention. The 200-day SMA is hard-coded into the risk-management rules of many systematic funds and is the reference in virtually every charting platform's default. Self-fulfilling coordination at the level makes the level matter, regardless of whether SMA or EMA is "mathematically better." The 200-day EMA exists but commands far less institutional attention.
Are SMA and EMA mathematically equivalent over long horizons? They converge in central tendency but never become identical. At 200 bars, the SMA and EMA values typically sit within 1–2% of each other on smoothly trending data; on volatile data the gap can be larger. They have different lag characteristics throughout — even at long N, the EMA is faster by a small but measurable margin.
Which one is better for stocks I hold long-term? For long-term holds, the moving average is mostly a context indicator (is the broader trend up or down?), not a signal indicator. SMA is fine. The 200-day SMA in particular tells you the regime at a glance and matches what institutional risk desks watch. Save the EMA debate for intraday and swing-trading contexts where reactivity drives outcomes.
Why do my charts show different SMA / EMA values than another platform? Three common causes: (1) different starting points for the EMA recursive calculation (some platforms seed from a simple mean of the first N bars; others from the first close), (2) different handling of after-hours / pre-market sessions, (3) different convention on which side of the bar the moving average is plotted (centered vs end-of-window). For consistency, PickSkill uses end-of-window plotting, SMA-seeded EMAs, and regular-session-only data — the conventions standard in academic backtests.