What Is a Moving Average? SMA, EMA, and the Trend Filter Everyone Uses
A moving average is the rolling mean of close price over N bars. Formula, why 20/60/200 are the standard windows, and four pitfalls retail readers fall into.
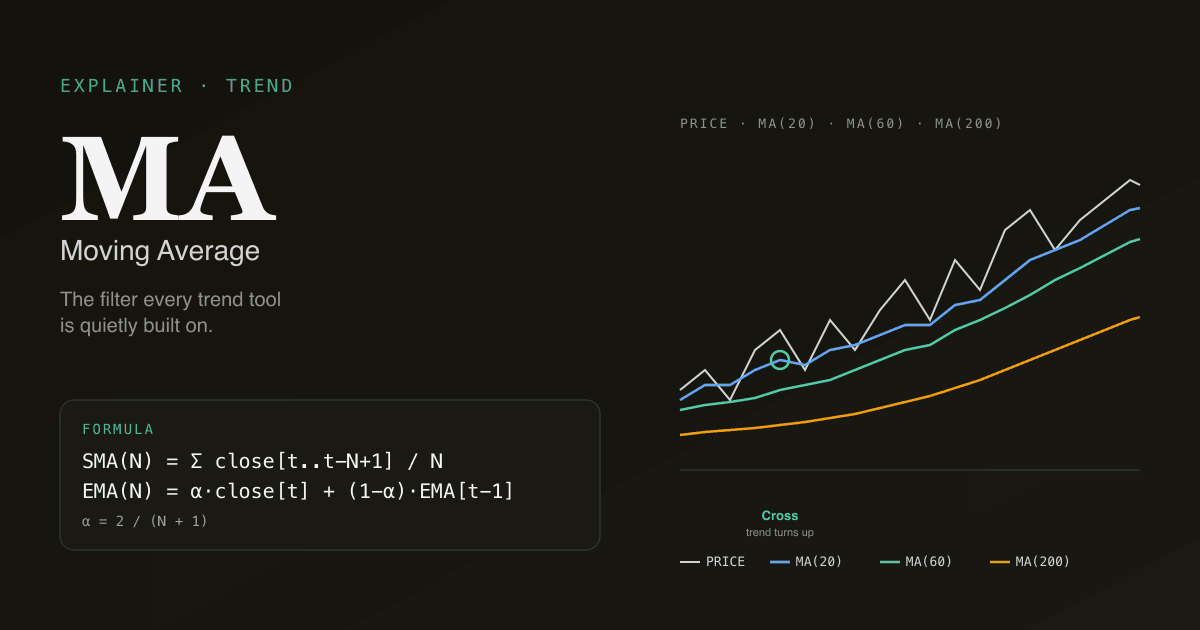
A moving average (MA) is the arithmetic mean of close price over the last N bars, recomputed on every new bar. It is the foundation of every trend-following indicator — MACD, Bollinger Bands, the Ichimoku cloud, golden / death crosses — all are constructed from one or more moving averages. Most retail guides treat MAs as standalone signals. They are not. MAs are filters; they answer "is there a trend?" so other tools can answer "what to do about it."
Key takeaways
- Two flavours dominate: SMA (simple — every bar weighted equally) and EMA (exponential — recent bars weighted more). MACD uses EMA; the 200-day "trend filter" is almost always SMA.
- Three windows do 90% of the work: 20-period (short term), 60-period (medium), 200-period (long term). On daily bars those translate to ~1 month, ~3 months, ~10 months.
- The cross between two MAs is the most-quoted signal in technicals. Price above MA = uptrend; price below = downtrend. A short MA crossing a long MA = the golden / death cross.
- MAs lag by construction. A 200-day SMA reflects ten months of price; it will not turn until the underlying trend has been moving for weeks. That lag is a feature when you use MAs as filters, a bug when you use them as triggers.
- Renders on every PickSkill indicator dashboard — the /indicators page draws the 20/60/200 stack on every chart so the trend regime is visible without leaving the holdings view.
How is a moving average calculated?
The simple moving average over N bars is the arithmetic mean:
SMA(N) = (close[t] + close[t-1] + ... + close[t-N+1]) / N
Every bar in the window carries equal weight. A 20-day SMA on a Friday close uses the last 20 trading-day closes (so ~4 calendar weeks); on Monday it drops the oldest day and adds the new one.
The exponential moving average weights recent bars more heavily:
EMA(N)[t] = α × close[t] + (1 − α) × EMA(N)[t−1]
            where α = 2 / (N + 1)
For N = 20, α ≈ 0.0952 — today's close gets ~9.5% weight, yesterday's EMA carries the rest. EMA reacts ~1–3 bars faster than SMA of the same length, which is why it shows up inside MACD (where reactivity matters) but not as the 200-day trend filter (where stability matters).
| Window | Daily-bar meaning | Typical use |
|---|---|---|
| 5-period | One trading week | Intraday or swing trading; rarely used alone |
| 20-period | One trading month | Short-term trend; Bollinger Bands' middle band |
| 60-period | One trading quarter | Medium-term regime |
| 200-period | ~10 trading months | The institutional "is the market up or down" filter |
What does the price-vs-MA relationship actually tell you?
Three states, three meanings:
- Price above the MA, MA sloping up. Confirmed uptrend. Pullbacks toward the MA tend to find support. This is when momentum signals (MACD golden cross, RSI breakouts) have their highest hit rate.
- Price oscillating around a flat MA. Range-bound chop. Every cross of the MA is a false signal in waiting. ADX below 20 confirms this regime — disable any trend-follower until ADX rises.
- Price below the MA, MA sloping down. Confirmed downtrend. Bounces toward the MA tend to fail. Long-only retail should respect this state and step aside; the MA is telling you the path of least resistance is down.
The standard "is the trend up?" institutional test: is the close above the 200-day SMA, and is the 200-day SMA itself sloping up? Two yeses = trend up. One yes / one no = early reversal candidate. Two nos = trend down. This single check filters out roughly half the false-positive setups produced by short-term indicators.
Why 20, 60, and 200?
These are not magic numbers — they are agreed-upon numbers. Several decades of trader convention have made them the de-facto windows that every quote-sourcing AI assistant, charting platform, and broker tool ships by default. Two practical consequences:
- Coordination value. Because everyone watches the 200-day, the 200-day matters. When price closes below the 200-day SMA on a major index, algorithmic risk-off triggers fire across systematic funds. The level is self-reinforcing.
- Backtest stability. Period optimisation on a single instrument routinely produces 17 or 43-period windows that look better in-sample and underperform out-of-sample. Sticking to the standard windows avoids overfitting your eyes to noise.
Use the standard windows. Move only when you have backtest evidence for a specific market or instrument that differs systematically.
Four pitfalls retail readers fall into
- Trading the MA cross as a standalone signal. A 20/60 cross has thin edge in isolation — historical hit rates hover around the long-run win rate of equities (so the "signal" is just market drift). It becomes useful only when combined with a trend filter and a confirmation oscillator. See the 3-indicator filter.
- Picking the window that fit the last six months. Retail blogs that recommend 13 / 34 / 89 (Fibonacci numbers) or some other exotic stack are usually fitting noise. Stick to 20 / 60 / 200 unless you can show out-of-sample evidence otherwise.
- Ignoring the MA's slope. A flat 200-day SMA is a different regime from an upward-sloping 200-day SMA, even if price is above the MA in both cases. Slope direction is half the information.
- Applying SMA to highly volatile or thin-traded names. Single outlier closes (gap-up earnings, limit-up days in A-shares) move the SMA disproportionately and produce false bias for the next 20 bars. EMA is more robust to outliers; for low-liquidity names, prefer EMA or use a median filter.
How moving averages behave on A-shares
The math is identical, but A-share market microstructure changes which MAs work:
- Daily price limits (±10% on main board, ±20% on ChiNext / STAR, ±5% on ST stocks). Consecutive limit-up days create a stair-step in the SMA that overstates trend strength for ~5 bars. Limit-down does the inverse. The PickSkill dashboards mark limit bars as neutral in the 5-day signal trail so a string of limit days does not produce a false strong-trend bucket.
- Halts (停牌) can run for days or weeks. Most data feeds fill the halted gap with the prior close, freezing the MA. When the stock resumes, the SMA effectively restarts; trend signals from before the halt should be treated as stale.
- Stronger MA10 / MA20 convention. The A-share retail community watches the 10-day MA more closely than the US community. Many local platforms ship a default 5 / 10 / 20 / 60 stack; the 200-day SMA is less culturally embedded. The 60-day MA functions as the medium-term filter in practice.
For a market-by-market comparison of how each indicator behaves differently between the US and A-shares, see MACD on A-Shares vs US Stocks.
See it on your portfolio. The /indicators page renders the 20 / 60 / 200 MA stack across every holding with the latest cross status and the 5-day trend-regime trail.
How MAs pair with other indicators
MAs are the filter layer; momentum oscillators are the trigger layer. The combination that consistently beats either alone:
| Layer | Tool | Question it answers |
|---|---|---|
| Trend filter | Price vs 200-day SMA + slope | Is there a trend? Which direction? |
| Trend strength | ADX | Is the trend strong enough to trade? |
| Momentum trigger | MACD cross, RSI extreme | When to act? |
| Volatility envelope | Bollinger Bands | How far is too far? |
The MA stack answers the first question for free, every day. Without it, every other indicator on the chart is operating blind.
Further reading
- Moving Average on Investopedia — comprehensive reference covering SMA, EMA, WMA, and adaptive variants.
- Jack Schwager's Technical Analysis — chapter 6 on moving-average systems remains the practitioner reference.
- The CFA Institute's curriculum on trend indicators — for the formal-finance treatment.
FAQ
Should I use SMA or EMA? Use SMA for long-window trend filters (200-day) — stability matters more than reactivity, and outlier closes are less likely to bias a long average. Use EMA for short-window momentum tools (the 12 / 26 inside MACD, or any 5–20-period system) — reactivity matters, and EMA's exponential weighting tracks recent prices better. Don't agonise over the choice for medium windows; the difference at 60 periods is small enough to be lost in market noise.
Why is the 200-day MA so closely watched? Two reasons: institutional coordination (systematic funds use it as a risk-off trigger, so it has self-fulfilling momentum at the level) and decades of empirical research (Bauer & Dahlquist, Faber, and others have shown that staying long when above the 200-day and going to cash when below produces returns close to buy-and-hold with materially lower drawdown). The level matters because the market acts as if it matters.
Can I optimise the MA window for my favourite stock? You can, but you probably shouldn't. Window optimisation reliably finds combinations that look great on the in-sample period and break on the next 12 months. Stick to the standard windows (20 / 60 / 200) unless you have a specific structural reason — a stock with abnormally high or low liquidity, an instrument with a clear seasonal cycle — to deviate. If you do optimise, hold out the most recent 30% of your data and require the optimised window to beat the default windows on the out-of-sample period.
Is the moving average a leading or lagging indicator? Lagging — by construction. Every term in the MA formula is built from past closes; there is no forecast in there. This is why MAs are most useful as filters (state of the world) rather than triggers (when to act). The MA tells you the trend exists; you need a separate tool to time the entry.
Why do my charts show a different MA value than another platform? Three common reasons: (1) different window definitions (5 trading days vs 5 calendar days), (2) different starting points for the EMA initialisation (some platforms seed from the first available close, others from an SMA of the first N bars), (3) different handling of after-hours / limit-up / halt sessions. For consistency, the PickSkill dashboards use trading-day windows with SMA-seeded EMAs and exclude halted bars from the average — the same convention used in academic backtests.