What Is a Golden Cross (and Death Cross)? The 50/200 MA Signal, Explained
A golden cross is the 50-day MA crossing above the 200-day MA. Formula, historical hit rates, why the cross alone is overrated, and how to use it properly.
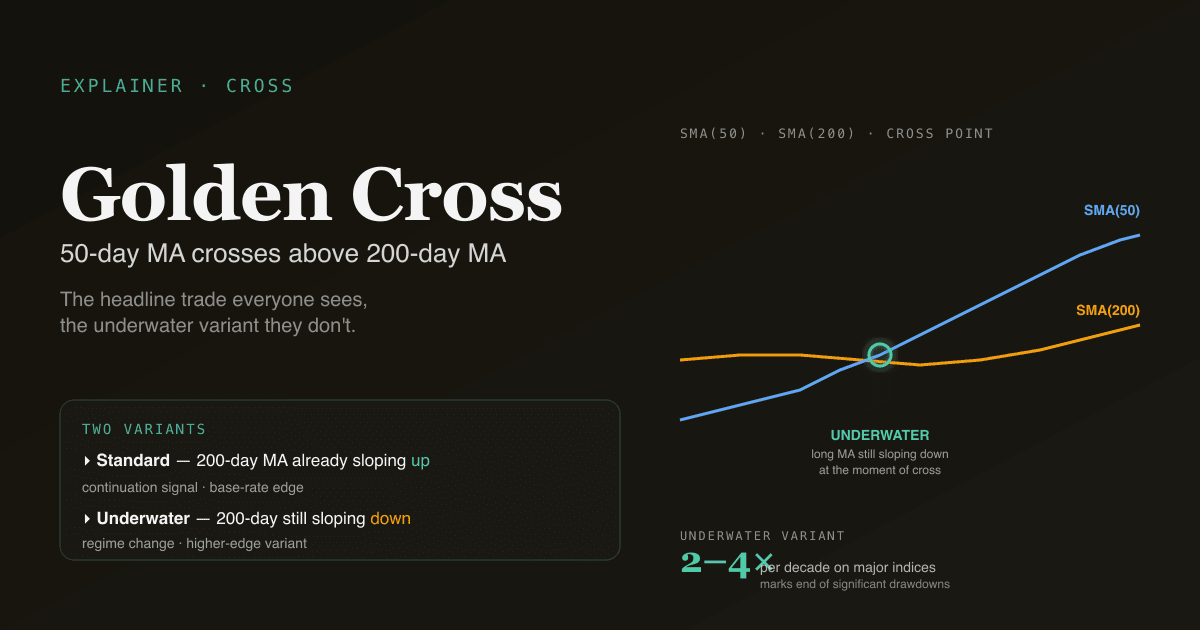
A golden cross is the moment a short-term moving average (typically the 50-day) crosses above a long-term moving average (typically the 200-day). A death cross is the opposite — the short MA crossing below the long one. Financial media love these crossings because they make great headlines. Backtests show the bare signal is closer to a coin flip than the headlines admit. The cross becomes useful only when you understand which version of it you are looking at and what state the underlying trend is in.
Key takeaways
- Standard definition: 50-day SMA crosses 200-day SMA on daily close. Some platforms use EMA(50) / EMA(200); the difference is small.
- Golden cross historical hit rate is moderate, not magical. On the S&P 500 since 1950, golden crosses have preceded 12-month returns of ~10–12% — close to the long-run market average. Skew comes from a few large winners.
- The "underwater" golden cross matters. When the cross happens with the 200-day still sloping down, the trend has not turned yet — you are catching the first sign of a possible turn, not a confirmed one. PickSkill flags these explicitly via the underwater golden cross signal.
- Death crosses signal regime change more reliably than golden crosses. Drawdowns following death crosses have averaged ~6–10% before recovery; they work better as risk-off filters than as short-selling triggers.
- Renders on the /indicators MA dashboard for every holding, with the cross history and underwater state explicitly marked.
How does the golden cross work mechanically?
Two moving averages, two slopes, one crossing point.
| Component | Formula | Meaning |
|---|---|---|
| Short MA | SMA(close, 50) | ~2.5 months of close — the medium-term trend |
| Long MA | SMA(close, 200) | ~10 months of close — the long-term trend |
| Cross | Short MA value goes from below to above Long MA value | "Medium trend is now stronger than long trend" |
The golden cross happens on one specific bar — the day Short crosses Long from below. Everything before that bar, Short was below Long; everything after, Short is above. The crossing is the discontinuity; whether it sticks depends on what happens next.
The same logic applies to other window pairs (20/60, 5/20 for shorter horizons), but the 50/200 is by far the most-watched because it answers the question institutional risk desks care about: "has the medium-term picture turned positive against the long-term picture?"
Why does the cross matter (and why is it overrated)?
The cross matters because two structural mechanisms reinforce it:
- Systematic risk-on / risk-off rules use it. A non-trivial share of trend-following funds and CTA strategies trade on simple MA cross rules. When the S&P 500 crosses its 200-day from below, those funds re-allocate to equities. The flow is real and self-fulfilling on the day of the cross — which is why volume often spikes around major index golden crosses.
- Financial media amplify it. "S&P 500 confirms golden cross" headlines drive retail flow. Whether the signal "works" or not, the attention shifts marginal capital.
It is overrated because the bare cross has weaker out-of-sample edge than commonly believed:
- Across global equity indices since 1970, the median 12-month return following a golden cross is roughly equal to the unconditional 12-month return for the same index. The mean is biased upward by a small number of large winners, which means the typical outcome is unremarkable.
- Crosses are highly path-dependent on the prior trend. A cross at the bottom of a deep drawdown ("first cross after bear market") has materially better forward returns than a cross during a long up-trend. The headline "golden cross" treats both identically.
This is where the underwater qualifier matters.
What is an "underwater" golden cross — and why is it the highest-value variant?
The 200-day SMA itself has a slope. The cross can happen in two regimes:
| Variant | 200-day slope at cross | Interpretation |
|---|---|---|
| Underwater golden cross | Sloping down | Trend has not yet turned; this is the first sign the downtrend may be breaking |
| Standard golden cross | Sloping up | Trend was already up; this is a continuation signal after a pullback |
The underwater version has historically produced the strongest forward returns — it captures regime change, not regime continuation. It is also the rarer of the two: across major US indices, underwater golden crosses occur roughly 2–4 times per decade, typically at the end of major drawdowns. Catching a few of those across a 20-year career is more valuable than reacting to every continuation cross.
The PickSkill underwater golden cross dashboard scans all holdings for this specific pattern — short MA above long MA, but long MA still sloping down. It is a deliberately narrow filter that surfaces the small number of names exhibiting the higher-edge variant.
How should a death cross be interpreted?
A death cross is the symmetric event: the 50-day SMA crosses below the 200-day SMA from above. The standard interpretation is "medium-term trend has rolled over relative to long-term trend."
Two practical points retail guides under-emphasise:
- Death crosses tend to be late, not early. By the time the cross prints, the market has often already dropped 15–25% from its peak. Treating the death cross as a "sell signal" at the moment of cross is selling the bottom of a phase, not the top.
- Their highest-value use is as a long-side risk filter, not a short-side trigger. "If the S&P closes below its 200-day SMA, I move long-only equity exposure to 50%" is a defensible rule supported by decades of drawdown data. "Short the S&P on a death cross" has a much worse risk/reward profile because of the dispersion of forward returns.
Four pitfalls in interpreting cross signals
- Treating the cross as binary. The cross is a moment; trends are processes. A cross followed by an immediate reversal back across the line ("whipsaw cross") is common in choppy markets and produces consecutive false signals.
- Ignoring the slope of the long MA. A cross with the long MA flat is much less informative than a cross with the long MA itself turning up. The combination of cross plus long-MA slope change is the higher-edge setup.
- Applying the cross to noisy single names. The 50/200 cross is most reliable on broad indices and large-cap names with smooth trends. On small-caps with frequent gaps, the cross fires repeatedly with no informational content.
- Forgetting the cross is a derivative signal. The cross is constructed from price; it cannot tell you more than what is already in the chart. Volume confirmation, breadth confirmation (how many sub-components are also crossing), and macro context all add information the cross alone cannot.
How crosses behave on A-shares
The 50/200 SMA cross is less culturally embedded in the A-share retail community than in the US. Local convention emphasises the 20/60 cross more, and the 5/10 daily cross for swing trading. Two structural effects to keep in mind:
- Daily price limits create stair-step patterns in both the 50-day and 200-day SMAs during runaway moves. Limit-up streaks delay the visible cross by 1–3 bars relative to a free-trading market. The cross itself still fires on the correct day; the moving averages just lag during the limit phase.
- Index reconstitution turnover. A-share indices reconstitute more aggressively than US indices. A cross on an A-share index can partly reflect index composition change rather than market trend change — for individual-stock signals the cross is unaffected, but for the broader index it is worth checking whether a reconstitution date is nearby.
For the broader market-by-market view, see Best Indicators for A-shares and MACD on A-Shares vs US Stocks.
Track it on your portfolio. The /indicators page renders the 50/200 cross status on every holding, with the underwater state flagged when the long MA is still sloping down. The 5-day trail shows how the cross status evolved across the trading week.
How to use the cross in a real workflow
The cross is most useful as one input in a multi-signal filter, not a standalone trigger. A practical workflow:
- Use the cross to define regime. Long-only allocation is active when price is above the 200-day SMA and the 50-day SMA is above the 200-day SMA. Reduce or hedge when both conditions fail.
- Use the underwater variant as a watchlist trigger. When an individual name prints an underwater golden cross, that name graduates from "ignore" to "research candidate." Confirm with fundamental work before sizing into the position.
- Use the death cross as a portfolio-level risk filter. Move from aggressive to defensive exposure when the broad index death-crosses; reverse when the index reclaims its 200-day SMA and prints a fresh golden cross.
The cross is a filter for when to look, not a trigger for what to do. Pair it with MACD for momentum confirmation, RSI for overbought/oversold context, and fundamental work for sizing.
Further reading
- Investopedia on the golden cross — comprehensive reference with historical examples.
- Meb Faber, A Quantitative Approach to Tactical Asset Allocation — the canonical academic paper showing simple MA cross rules produce risk-adjusted outperformance over time.
FAQ
Does the golden cross actually work? The bare 50/200 cross has historically produced forward 12-month returns roughly in line with the unconditional market return — close to a coin flip on a per-signal basis. The signal becomes meaningfully positive only when combined with the underwater state (long MA still sloping down), volume confirmation, and breadth confirmation. Treat the cross as a watchlist trigger and a regime filter, not a buy button.
Is a 50/200 cross different from a 20/60 cross? Yes — different horizons answer different questions. The 50/200 (≈2.5 months vs ≈10 months) speaks to medium- vs long-term regime; the 20/60 (≈1 month vs ≈3 months) speaks to short- vs medium-term momentum. The 20/60 produces more frequent signals but lower per-signal edge. Most institutional risk frameworks use the 50/200; swing traders watch the 20/60 or 5/20.
What is the difference between a golden cross and a bullish moving-average crossover? The terms are often used interchangeably, but strictly: "golden cross" specifically denotes the 50/200 SMA cross on a daily-bar chart. Any other window pair (10/20, 20/60, 5/13) is a "bullish moving-average crossover" but not the golden cross. The distinction matters mostly in financial-media headlines, which reserve "golden cross" for the 50/200 event.
Why is the cross "late"? Both inputs are lagging indicators. The 50-day SMA reflects the last ten weeks of close; the 200-day reflects the last ten months. By the time the short crosses the long, the underlying price has typically been moving for weeks already. The cross is a confirmation event, not an anticipation event. If you want earlier signals, you need leading indicators (volume profile, options skew, breadth divergence) — but those have their own false-positive problems.
Can I trade options on a golden cross? You can, but the structure is awkward. The cross is a low-frequency event (a few times per year on a single ticker, maybe weekly across a 50-name portfolio), and the implied volatility around the cross is often already pricing in some level of trend recognition. Buying calls at the moment of the cross often pays a premium for the headline. The higher-edge variant is to position before the cross, using the underwater setup and an oversold RSI reading as the watchlist trigger.