What Is the P/E Ratio? Trailing, Forward, and Shiller Variants
P/E = price / earnings per share. The trailing, forward, and Shiller forms; the 4 traps that bend comparisons; and how to anchor against peers.
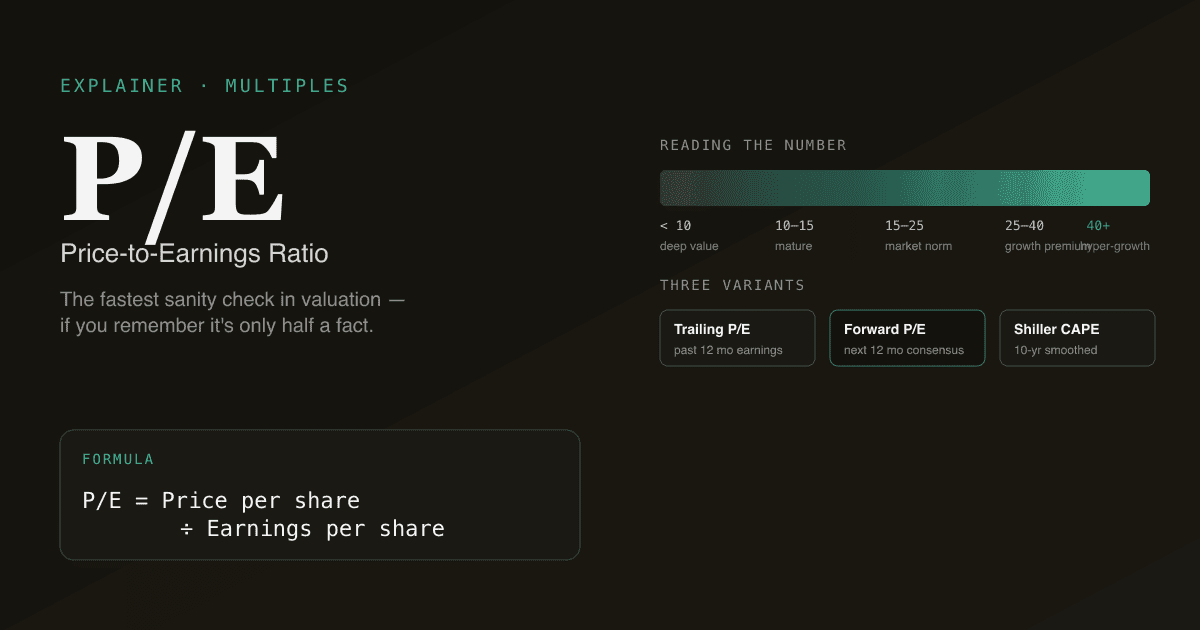
The P/E ratio (price-to-earnings) is the most quoted number in equity markets. It's also the most misunderstood. P/E answers a simple question — how much are investors paying per dollar of current earnings? — but a single P/E number tells you almost nothing without context: which earnings? trailing or forward? GAAP or adjusted? Compared against what? Used correctly, P/E is the fastest sanity check in valuation. Used carelessly, it's the source of most "this stock looks cheap" theses that turn out to be wrong.
This guide covers the formula, the variants that actually matter (trailing twelve months vs. forward, Shiller CAPE), the signal P/E gives, and the four traps that bend P/E comparisons in real research.
Key takeaways
- P/E = Price per share / Earnings per share. A simple ratio with a deceptively complex denominator.
- Three variants worth knowing: trailing twelve months (TTM, backward-looking), next twelve months (NTM, forward-looking, the analyst default), and Shiller CAPE (10-year smoothed, the macro-comparison gold standard).
- A high P/E means the market expects growth; a low P/E means the market sees risk or decline. Neither is automatically good or bad — context is everything.
- P/E lies when earnings lie. Cyclical troughs (low E, high P/E), one-off gains (high E, low P/E), and aggressive GAAP-vs-adjusted reconciliations all distort P/E.
- P/E only works in comparison — against the company's own history, against peers, against the market. A bare P/E number is half a fact.
- PickSkill computes P/E across all three variants and benchmarks against peer set + own history in one prompt.
What is the P/E ratio?
The formula is one line:
P/E = Price per share / Earnings per share
Or equivalently, at the company level:
P/E = Market capitalisation / Net income
If a company trades at $150 per share and earns $5 per share, its P/E is 30. The market is paying $30 today for every $1 of current earnings — which is only meaningful when paired with a view on whether earnings will grow, hold, or decline.
The earnings used in the formula matter as much as the price:
- Trailing P/E (TTM P/E): uses earnings from the past 12 months. Backward-looking. The most defensible because the earnings are real, but rear-view-only.
- Forward P/E (NTM P/E): uses consensus estimates of earnings over the next 12 months. Forward-looking. This is what most professional analysts quote.
- Shiller P/E (CAPE): uses 10-year inflation-adjusted earnings as the denominator. Smooths out cycles. Mainly used at the market level (S&P 500) for macro comparisons, not for individual stocks.
What does the P/E ratio signal?
P/E reflects two things bundled together: expected growth and perceived risk.
| P/E reading | Typical interpretation |
|---|---|
| < 10 | Either deep value, depressed earnings (cyclical trough), or a structurally challenged business the market expects to decline |
| 10–15 | Mature, stable business with low-to-moderate growth expectations |
| 15–25 | "Normal" range for the broad US market over the past 20 years; reasonable growth + reasonable risk |
| 25–40 | Above-market multiple; the market is pricing in meaningful growth ahead |
| > 40 | Either hyper-growth pricing (NVDA at peak, software bellwethers) or depressed earnings inflating the multiple (post-COVID 2020 retail) |
The key word is interpretation. A 40× P/E on a company growing 30% with high free cash flow conversion is rational. A 40× P/E on a company growing 5% is a story stock waiting to break.
For the framework that prices growth properly, see What Is DCF? — P/E is the relative-valuation shorthand for the same exercise.
The four traps that bend P/E comparisons
P/E is most useful when comparing — against peers, against the company's own history, against the market. Four traps regularly bend the comparison:
- Cyclical earnings. A cyclical stock at the trough of a cycle has depressed earnings, which mechanically inflates P/E. A steel producer with a 30× P/E in the bottom of a cycle might look expensive next to a 12× tech name — but the steel producer's "normalised" earnings (across the cycle) would put P/E closer to 10×. Average earnings across the cycle, then compute P/E.
- One-off items. A $500M divestment gain in net income lowers P/E mechanically without changing the underlying business. Always check whether reported earnings include items that won't recur. Adjusted earnings (non-GAAP, EBITDA, "core") strip these out — for better or worse depending on how aggressive the company is.
- Stock-based compensation. GAAP earnings include SBC as an expense; the company's "adjusted" earnings usually exclude it. Big tech adjusted earnings can be 30–50% higher than GAAP for this reason alone. A 20× P/E on adjusted EPS becomes a 30× P/E on GAAP EPS — same company, very different reading. See What Is FCF? on the SBC treatment that bends multiples.
- Cross-sector comparisons. Utilities trade at 12–15× because they're slow-growth, stable. Software trades at 35× because it's fast-growth, less stable. Comparing them on raw P/E is comparing apples to oranges — the underlying earnings dynamics are structurally different.
The 134-word rule: never quote a P/E without an anchor. It either compares to the company's own history, to its peer set, or to a long-run market norm — otherwise it's not data, it's vibes.
P/E vs. other multiples
| Multiple | Best for | Caveat |
|---|---|---|
| P/E | Mature, profitable businesses with stable earnings | Breaks at zero/negative earnings; sensitive to accounting choices |
| Forward P/E | Growth businesses where current earnings understate the run-rate | Depends on consensus estimates being right |
| EV/EBITDA | Capital-intensive businesses where D&A matters; cross-capital-structure comparison | Ignores capex, so flatters capital-intensive companies — see What Is EV/EBITDA? |
| EV/Sales | Money-losing growth companies (early-stage SaaS, biotech) | Says nothing about profitability |
| P/Book | Banks and asset-heavy businesses where the balance sheet is the asset | Useless for asset-light businesses |
| PEG (P/E ÷ growth) | Comparing P/E across companies with different growth rates | Garbage in / garbage out on the growth estimate |
For the bigger picture on absolute vs. relative valuation, see DCF vs Comparable Company Analysis.
How to use P/E productively
A simple workflow that survives review:
- Pull the company's TTM P/E and NTM P/E. The gap between them tells you the market's growth expectation.
- Pull the same two ratios for 5–8 peers. Compute the median.
- Compute the company's own 5-year P/E range (low, average, high). Where is the current P/E inside that range?
- Ask: why is the current P/E where it is? If it's above the peer median and above the company's own history, the market is pricing in something — what?
- Stress-test the implied growth. If the current P/E only makes sense at 20% earnings growth for 5 years, ask whether that growth is plausible.
This is exactly the workflow PickSkill runs when you ask for a "P/E comparison".
How PickSkill uses P/E
Open /chat and type:
"Pull NVDA's TTM and NTM P/E, compare against its 5-year history and against AMD, AVGO, INTC, and TSM. Show me what implied earnings growth the current P/E implies relative to peers."
PickSkill pulls the TTM P/E from the most recent 10-K/10-Q, the NTM P/E from consensus estimates, the 5-year P/E range for the company, the same two metrics for the peer set, and computes the implied multi-year earnings growth that would justify the current multiple. The output is a single table — the kind of thing that would take 40 minutes of spreadsheet work to assemble by hand.
This pairs with the Comps workflow — P/E is the headline; Comps is the structured table behind it.
FAQ
What's the difference between TTM and NTM P/E? TTM = trailing twelve months, looking backward. Real earnings the company reported. NTM = next twelve months, looking forward. Consensus analyst estimates of what earnings will be. Forward P/E is what most professional analysts quote because investing is about the future; trailing P/E is what's defensible if you don't want to depend on consensus being right.
What's a "good" P/E? There's no universal "good" P/E. A 12× P/E on a utility is fair value; a 12× P/E on a SaaS company growing 30% would suggest the market thinks the growth is fake. Always anchor against (a) the company's history, (b) peers, (c) the broader market.
What's the Shiller P/E (CAPE)? The Cyclically Adjusted P/E ratio, popularised by Yale economist Robert Shiller. Uses 10-year inflation-adjusted earnings as the denominator to smooth out cycles. Mostly used at the market level (S&P 500 CAPE is famous) to assess whether stocks are expensive vs. their long history. Not particularly useful for individual stocks.
Can a P/E be negative? Mathematically yes, when earnings are negative. In practice analysts report "N/M" (not meaningful) for negative-earnings stocks and switch to EV/Sales or EV/EBITDA instead. P/E only works when earnings are positive and reasonably stable.
Where do I find a stock's P/E? Most financial data services (Yahoo Finance, Bloomberg, your broker) display TTM P/E by default. Forward P/E requires consensus estimates, usually from sell-side aggregators. PickSkill computes all three (TTM, NTM, Shiller) from primary sources — SEC filings + market data — and shows the gap between them as a signal in itself.