What Is EV/EBITDA? The Multiple That Sees Through Capital Structure
EV/EBITDA values a firm on operating profit before interest, tax, depreciation. Formula, sector typical bands, when it beats P/E, and the pitfalls.
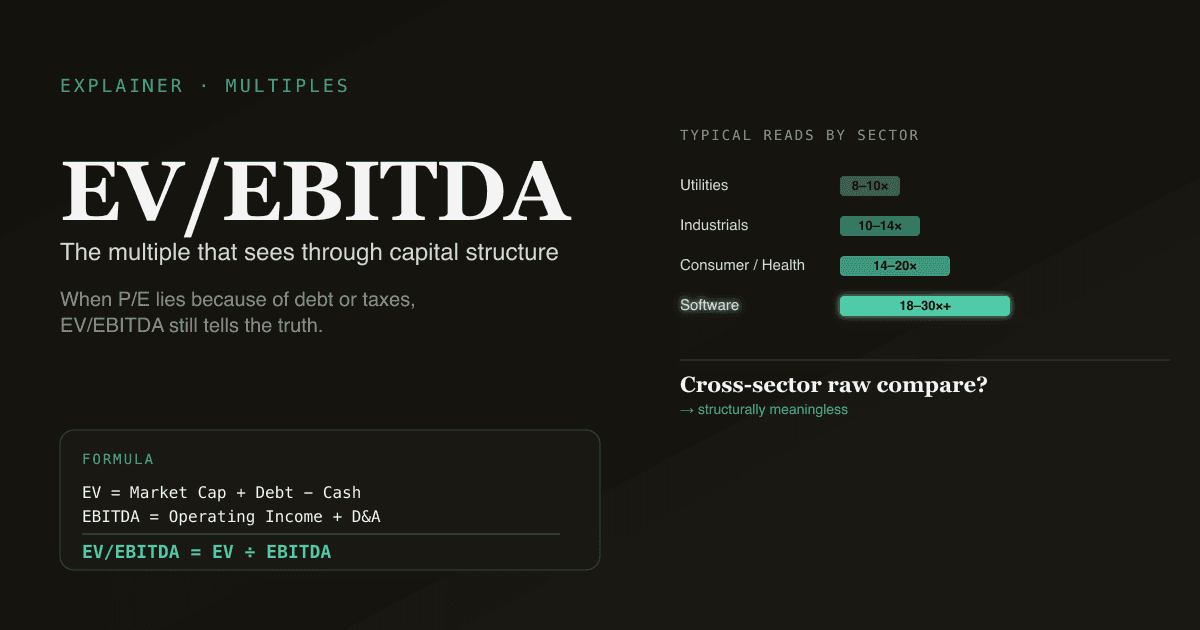
EV/EBITDA is the valuation multiple that sees through capital structure. Where P/E divides the equity price by post-interest, post-tax earnings — both of which depend on how a company is financed and taxed — EV/EBITDA divides enterprise value (the value of the whole business) by EBITDA (earnings before the things financing and accounting choices distort). The result is a multiple that lets you compare two companies in the same industry even if one is debt-loaded and one is debt-free.
This guide covers the formula, when EV/EBITDA beats P/E, where it flatters capital-intensive companies, and how to use it without falling into the typical traps.
Key takeaways
- EV/EBITDA = Enterprise Value ÷ EBITDA. Enterprise Value = market cap + debt − cash + minority interest. EBITDA = earnings before interest, taxes, depreciation, and amortisation.
- It's capital-structure-agnostic. Comparing companies with different debt levels is the main reason EV/EBITDA exists. P/E breaks under that comparison; EV/EBITDA doesn't.
- It flatters capital-intensive companies by ignoring capex. A steel mill spending $1B/year on capex looks "cheaper" on EV/EBITDA than the same EV/EBITDA on a software company that spends almost nothing.
- Typical reads: 8–10× for utilities, 10–14× for industrials, 14–20× for consumer/healthcare, 18–30×+ for software. Always anchor against peers and the company's own history.
- PickSkill computes EV/EBITDA with the full peer-set comparison and an automatic flag when EV/EBITDA contradicts P/E (a useful signal about capital structure or accounting choices).
What is EV/EBITDA?
The formula:
EV/EBITDA = Enterprise Value / EBITDA

Where:
  Enterprise Value = Market Cap + Total Debt − Cash & Equivalents + Minority Interest
  EBITDA           = Operating Income + Depreciation + Amortisation
                  (or Net Income + Interest + Tax + D&A — same number)
Enterprise Value (EV) is the total cost to acquire the whole business — buy out all the equity AND assume the debt, with the cash on hand offsetting some of that cost.
EBITDA strips out the four things that aren't operating earnings: interest (financing choice), taxes (jurisdiction), depreciation, and amortisation (both non-cash accounting allocations). What's left is a rough proxy for operating cash generation before capex and working capital.
The ratio tells you how many years of EBITDA it would take to "earn back" the enterprise value at current run-rate — except multiples don't usually compress to 1.0, so think of it as a market expectation indicator more than a payback.
When EV/EBITDA beats P/E
Three situations:
- Companies with different debt levels. A leveraged company has higher interest expense, lower net income, higher P/E (mechanically). EV/EBITDA cuts above the interest line — the comparison stays clean. The classic example: comparing telecom companies, where debt loads vary enormously.
- Recent acquisitions distorting amortisation. When a company buys another, intangible-asset amortisation can swing for years. P/E reflects this; EBITDA doesn't.
- Cross-border comparisons. Different tax regimes make P/E noisy. EV/EBITDA is jurisdiction-neutral.
When EV/EBITDA misleads
Three situations where the multiple flatters:
- Capital-intensive businesses. A steel mill, telco, or airline spends 5–15% of revenue on capex every year. EBITDA ignores that. EV/EBITDA can make a heavily-capex business look cheap when the FCF picture (after capex) is much weaker. Always pair EV/EBITDA with FCF yield — see What Is FCF?.
- Software companies with capitalised dev costs. SaaS firms capitalise internal-use software, moving it from operating expense to capex (where EBITDA doesn't see it). A "32× EV/EBITDA" SaaS company may look the same as another "32×" peer that doesn't capitalise — but its underlying cash economics are different.
- Companies adjusting EBITDA aggressively. "Adjusted EBITDA", "Pro Forma EBITDA", "EBITDAS" (stock-based-comp-excluded) — every adjustment widens the gap between EBITDA and actual cash. Always read the EBITDA reconciliation in the 10-K (see How to Read a 10-K) before trusting any EBITDA number.
EV/EBITDA reading bands (rough)
| Sector | Typical EV/EBITDA |
|---|---|
| Utilities | 8–10× |
| Industrials / Materials | 10–14× |
| Consumer / Healthcare | 14–20× |
| Software / Internet | 18–30×+ |
| Banks | Not used (P/E or P/Book instead) |
Cross-sector comparisons on raw EV/EBITDA are not meaningful — utility 9× vs software 25× is a structural difference, not "software is more expensive". Always compare within the sector and against the company's own history.
EV/EBITDA vs P/E — which to use
| Use EV/EBITDA when | Use P/E when |
|---|---|
| Comparing across capital structures | Comparing peers with similar leverage |
| Comparing across jurisdictions / tax regimes | Same-country comparison |
| Heavy non-cash amortisation distorting net income | Stable, clean income statement |
| Cross-acquirer comparison after M&A | Mature, no recent deals |
| Acquisition / LBO analysis | Pure equity-side comparison |
For the bigger picture on absolute vs. relative valuation, see DCF vs Comparable Company Analysis.
How PickSkill uses EV/EBITDA
Open /chat and type:
"Compare AMD, AVGO, INTC, and NVDA on EV/EBITDA — TTM and NTM — against their 5-year averages. Flag any name where EV/EBITDA and P/E disagree on whether it's cheap or expensive."
PickSkill pulls the EV components (market cap + debt + minority interest − cash) and EBITDA (TTM + consensus NTM) for each ticker from SEC filings + market data, computes both EV/EBITDA and P/E, and explicitly flags the cases where the two multiples disagree — a useful signal that capital structure, amortisation, or aggressive EBITDA adjustments are doing real work.
This pairs with the DCF vs Comps comparison; EV/EBITDA is typically the headline multiple in the Comps table.
FAQ
What's a "good" EV/EBITDA? There's no universal good. 9× is fair for utilities; 9× would be cheap for software unless something's broken. Always anchor against peers and own history.
What's the difference between EV and Market Cap? Market cap = equity only. EV = equity + debt − cash + minority interest. Same business; EV captures the total cost to acquire it including assumed debt.
Should I use Forward or Trailing EBITDA? Forward (NTM) is the default for analyst comparisons because it reflects expected run-rate. Trailing (TTM) is more defensible because the EBITDA is actually reported. Use both — the gap between them implies the consensus growth view.
Is EV/EBITDA the same as EV/EBIT? No — EBIT subtracts depreciation and amortisation, EBITDA doesn't. EV/EBIT is closer to a "true earnings" measure; EV/EBITDA is closer to operating cash flow before capex. Use EV/EBIT for capital-intensive businesses where capex actually matters; EV/EBITDA for asset-light comparisons.
Where does PickSkill source EBITDA? Computed directly from the income statement and cash flow statement in the most recent 10-K/10-Q. Reconciles to the company's own reported EBITDA when one exists; flags the adjustments the company applies (SBC exclusion, restructuring add-backs, etc.) so you can see how aggressive the reported number is.