DCF vs Comparable Company Analysis — Which to Use, When
DCF prices the future cash; Comps price the present multiple. When to use each, the failure modes of each, why professionals triangulate both.
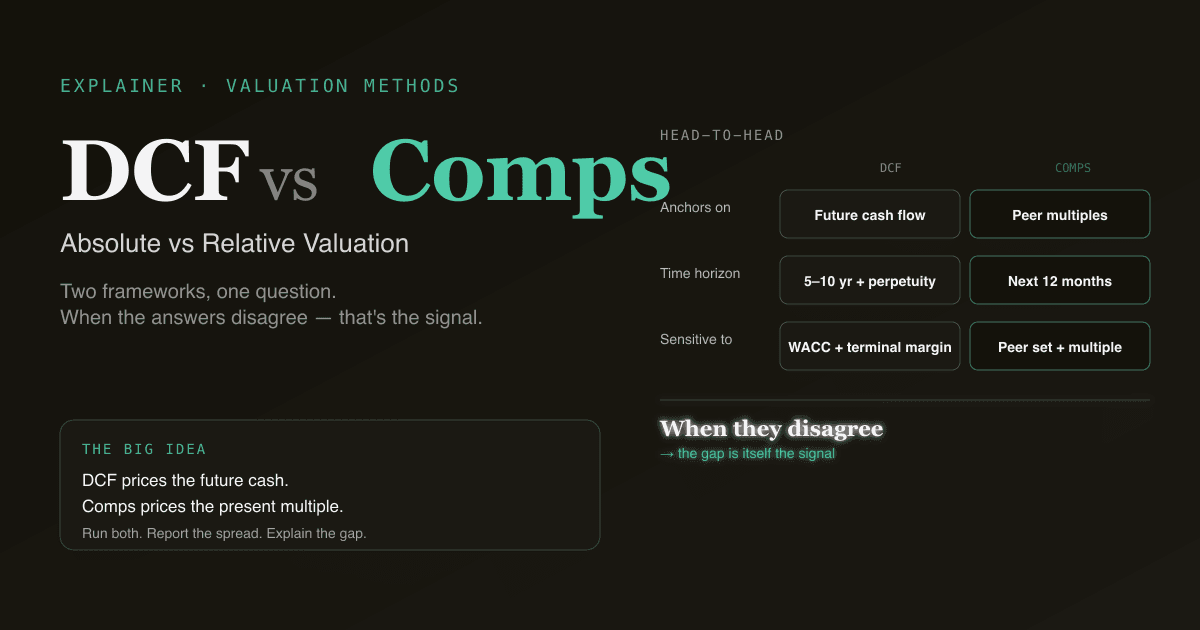
The two methods every equity-research analyst learns first are DCF (discounted cash flow) and Comparable Company Analysis (also called "Comps" or "trading multiples"). They answer the same question — what's this stock worth? — by completely different routes. DCF is absolute: it builds value from the company's own future cash. Comps is relative: it prices the company against what the market pays for similar companies today. Knowing when to lean on which one is the difference between a model that survives review and one that doesn't.
This guide walks through the side-by-side comparison, when each method works best, the failure modes of each, and why most professional sell-side and buy-side analysts run both and triangulate.
Key takeaways
- DCF prices the future cash; Comps prices the present multiple. Same question, completely different frameworks.
- Use DCF when: the business is stable enough to forecast 5+ years of cash, you have a view on long-term margins, you want to test "is the market wrong?"
- Use Comps when: the business changes too fast for a confident long-term forecast, you need a sanity-check, you're benchmarking against peers, or the multiple structure of the sector is the load-bearing piece of the argument.
- Most professional models triangulate both and report the spread. A persistent 30%+ gap between DCF and Comps is itself a useful signal — usually about peer-set selection or terminal-margin assumptions.
- PickSkill runs both —
/chatproduces a DCF + a Comps table side-by-side from one prompt, with the spread and a one-line reading.
What is DCF?
A DCF (discounted cash flow) values a company by projecting its free cash flow for 5–10 years, discounting each year back to today using a WACC, and adding a terminal value that represents everything beyond the projection. The formula:
EV = Σ FCFₜ / (1 + WACC)ᵗ + TV / (1 + WACC)ⁿ
For the full framework — the four assumptions that move 95% of the answer, the common pitfalls, and the workflow — see What Is DCF?.
DCF is the absolute method: the answer doesn't depend on what other companies trade at. It depends on what this company is expected to produce and what discount rate compensates for the risk.
What is Comparable Company Analysis?
Comps values a company by applying the trading multiples of a peer group to the target. Pick 5–10 publicly traded peers, observe what the market currently pays for them (EV/EBITDA, EV/Sales, P/E, etc.), apply those multiples to the target's financials, and back out an implied price.
A worked sketch:
Peer group EV/EBITDA range: 10× – 14× (median 12×)
Target company NTM EBITDA: $2.0B
Implied EV:                12× × $2.0B = $24B
Less net debt:             $24B − $4B = $20B equity
Implied price per share:   $20B / 200M shares = $100
For the multiples themselves, see What Is P/E Ratio? and What Is EV/EBITDA?.
Comps is the relative method: the answer is whatever the market is willing to pay for similar businesses today. If the whole sector re-rates, the Comps value moves with it.
The side-by-side comparison
| Dimension | DCF (Absolute) | Comps (Relative) |
|---|---|---|
| What it values | The company's own future cash | The company's place in today's market |
| Key input | Long-term FCF + WACC | Peer set + chosen multiple |
| Time horizon | 5–10 years explicit + perpetuity | Implicit (next 12 months earnings, mostly) |
| Sensitive to | Terminal margin, WACC, growth | Peer-set selection, choice of multiple |
| Strongest when | Cash flow is stable & forecastable | Peers exist and trade actively |
| Weakest when | Business model is in transition | No clean peers, or the whole sector is mispriced |
| Output character | Standalone intrinsic value | Relative-to-peers value |
| Re-rating risk | Low (terminal assumptions fixed) | High (peer multiples can compress fast) |
| Reviewer scrutiny | "Defend the WACC and the terminal" | "Defend the peer set and the multiple" |
When DCF works best
- Stable, mature businesses with predictable cash flow patterns. Utilities, consumer staples, industrials with established demand.
- You have a defensible view on long-term margins. DCF rewards conviction on terminal EBIT margin — if you know why margins will land where they land, DCF lets you say so.
- The market is wrong, you suspect. If the market is pricing the stock based on near-term noise, a DCF anchored on long-term cash is the right tool to demonstrate the gap.
- Cyclical bottoms. Comps in a cyclical trough look terrible (low multiples on depressed earnings); DCF normalises across the cycle.
DCF fails on early-stage businesses, hyper-growth names where 5-year-out assumptions are guesses, and businesses going through a structural shift (model transitions, regulatory inflection points).
When Comps works best
- The peer set is clean. Software/SaaS, where 10+ pure-play peers trade actively. Banks, where regulatory accounting makes comparison stable.
- You want a sanity check. A DCF that implies a value 50% above the closest peer's trading multiple needs a story for why this company deserves that premium.
- Sector-wide re-rating is the trade. If your thesis is "the market is going to re-rate the entire sector higher", Comps captures that — DCF can't really.
- Limited visibility on long-term cash. When forecasting 7 years out is fiction, a 12-month-forward multiple from peers is more honest.
Comps fails when peers don't exist (a unique business), when peers are mispriced as a sector (the whole 2000 internet sector), or when the multiple chosen is structurally inappropriate (P/E on a money-losing company).
Common failure modes
The 134-word checklist:
- DCF: terminal-value tail-wags-dog. Terminal value is 60–80% of EV in a typical 5-year DCF — if you're casual about the terminal growth rate or exit multiple, you're casual about most of the answer.
- DCF: false precision. Reporting an implied share price to two decimal places implies a confidence the model doesn't earn. Report a range.
- Comps: peer-set cherry-picking. Choosing the 3 highest-multiple peers and calling it a "median" is the most common abuse in sell-side research. Pick peers by business model, not by multiple.
- Comps: multiple-cycle mismatch. Applying today's multiple to a forecast 2 years out implicitly assumes multiples don't change. They do.
- Triangulation without honesty. Reporting "our target is the average of DCF and Comps" without acknowledging which method you trust more is a tell that you're hedging.
Why most professionals run both
The two methods are complementary, not substitutes. Common practice:
- Run DCF. Get an intrinsic value range based on your view of fundamentals.
- Run Comps. Get a relative-value range based on what peers trade at today.
- Report the spread. If DCF says $100 and Comps says $75, the spread is the interesting question. Usually one of three things:
- Your terminal margin is more optimistic than what peers' earnings imply.
- The sector is currently mispriced (your view) and DCF captures the "correct" price.
- Your peer set is wrong — you've included names with structurally different economics.
The triangulation conversation — explaining why DCF and Comps disagree — is where most of the analytical edge gets surfaced. A model where DCF and Comps agree to within 10% usually means nothing interesting is being said.
How PickSkill runs both
Open /chat and type:
"Value NVDA using both DCF and trading-multiple comps. Give me the implied price from each, the spread, and a one-line reading of where the spread comes from."
PickSkill runs the DCF workflow (sourced inputs from SEC filings + Damodaran + current yields), builds a Comps table from a peer set you can override (default is the company's reported segment peers from the 10-K), and shows you both implied prices side-by-side with the spread and the dominant driver of the gap.
Add "...and also show the EV/EBITDA spread between NVDA and the peer median over the last 8 quarters" to see whether the current relative multiple is a recent re-rating or a stable structural premium.
FAQ
Which method is more "correct"? Neither. They answer different questions. DCF asks what the cash flow stream is worth in isolation; Comps asks what the market is currently paying for similar streams. Both are right; they just disagree because they're using different reference frames.
Why do they often disagree by 20–40%? Usually one of: (1) you're more optimistic on terminal margin than the market is on peers' run-rate margin; (2) your peer set has a different blend of growth vs. quality than the target; (3) the sector is currently mispriced relative to long-term fair value. The size of the gap is informative — explaining it is where the analyst earns their fee.
Can I use both for the same target price? Yes, and most sell-side targets are a weighted blend of DCF, Comps, and (often) precedent transactions. The weights are judgement — typically 50% DCF / 30% Comps / 20% transactions for mature names; tilted more toward Comps when the business is too dynamic for long-term cash forecasts.
What about EV/EBITDA, EV/Sales, P/E — which multiple should I use in Comps? Pick the multiple that's most stable for the sector. For capital-intensive cyclicals: EV/EBITDA. For software/SaaS with negative GAAP earnings: EV/Sales or EV/ARR. For mature stable businesses: P/E. For banks: P/Book or P/Tangible Book. Using P/E on a hyper-growth tech name with no earnings is a classic mistake.
Does PickSkill auto-pick the peer set? Yes, with a default — typically the names the target lists in its 10-K Item 1 "competition" subsection, filtered for active liquid trading. You can override the peer set in the chat ("use these 6 peers instead") and PickSkill re-runs the Comps with your set. The peer set is the single most opinionated input in Comps; making it editable is the point.