What Is Free Cash Flow (FCF)? The Number Behind Every Honest Valuation
FCF is the number behind every honest valuation. FCFF vs FCFE, how to compute from a cash flow statement in 60 seconds, and four tech-company pitfalls.
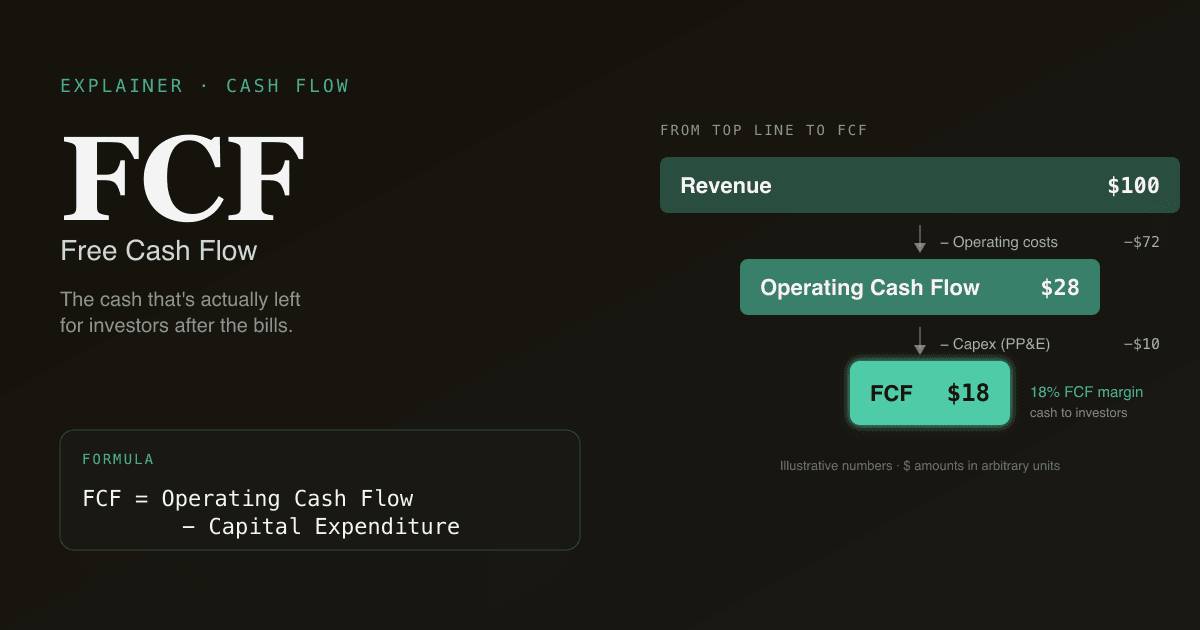
Free cash flow (FCF) is the cash a business generates that's actually available to investors after paying for operations and maintaining the asset base. It's the number a valuation model wants — not accounting earnings, which can be reshaped by depreciation choices, working-capital swings, or stock-based compensation. If a company's earnings look great but its FCF doesn't keep up, that gap is usually the most important thing you need to understand about the stock.
This guide covers the definition, the two flavours that matter (FCFF and FCFE), how to pull FCF from a cash flow statement in under a minute, and the four pitfalls that bend tech-company models in particular.
Key takeaways
- FCF = operating cash flow − capex. Cash from the business, minus the capital required to keep it running.
- Two flavours: FCFF (free cash flow to the firm — for unlevered DCF, ignores capital structure) and FCFE (free cash flow to equity — for levered DCF).
- FCF beats earnings for valuation because it strips out non-cash items (D&A, SBC), captures actual capex, and reflects working-capital changes that GAAP profit hides.
- Stock-based compensation is real cost. Add-back SBC without modelling dilution and a tech company's FCF looks 5–15% better than it actually is.
- PickSkill computes FCF from any company's last four 10-Q + 10-K filings in under a minute — both flavours, with the source line items linked for verification.
What is the FCF formula?
The starting point is the cash flow statement. Two paths, depending on which flavour you need:
FCFF (unlevered) = Operating Cash Flow + Interest × (1 − t) − Capex
FCFE (levered)   = Operating Cash Flow − Capex + Net Borrowing
Where:
| Term | Meaning |
|---|---|
| Operating Cash Flow (OCF) | Cash generated by the business after working-capital changes. Top of the cash flow statement's "operating" section. |
| Capex | Capital expenditure — money spent on property, equipment, software, infrastructure. Bottom of the "investing" section, labeled "purchases of property and equipment" or similar. |
| Interest × (1 − t) | After-tax interest expense, added back for FCFF so the number isn't biased by capital structure. |
| Net Borrowing | New debt issued minus debt repaid. For FCFE, this is the cash that ends up with equity holders after the lenders are paid. |
Both flavours subtract capex, because cash spent on the building, the data centre, the manufacturing line — that cash isn't available to you as an investor. It's reinvested in the business. A growing company can have spectacular OCF and negative FCF because all the cash is being plowed back into expansion.
Why does FCF matter more than earnings?
Earnings are the headline number — the one that beats or misses consensus on every earnings call. But FCF is what most professional valuation work runs on. Three reasons:
- Earnings are easier to bend. Depreciation timing, inventory accounting, accruals, deferred revenue — all GAAP-legal levers that move earnings without moving cash. FCF strips most of those out by going straight to the cash flow statement.
- Capex is real, and earnings hide it. A capital-intensive business (semis, telcos, airlines) spends billions on equipment that depreciates over a decade. Earnings show the depreciation; FCF shows the actual cash spent in the period. They can differ by 30–50% in a given year.
- DCF wants FCF. The discounted cash flow model is named for what it discounts — cash flow. Using earnings as a proxy is what creates the kind of valuation work that doesn't survive a downturn (because earnings hold up when cash flow has already collapsed).
How to pull FCF from a cash flow statement in 60 seconds
A practical workflow on a real filing:
- Open the company's latest 10-Q or 10-K on SEC EDGAR. Go to the cash flow statement (usually 4–5 pages into the financials).
- Read "Net cash provided by operating activities". That's OCF. The most reliable single number on the statement.
- Read "Capital expenditures" or "Purchases of property and equipment" from the investing section. Note the negative sign — capex is a cash outflow.
- Compute FCF = OCF − Capex. For unlevered DCF use, also add back after-tax interest expense (find interest on the income statement; multiply by
1 − marginal tax rate). - Verify against the press release. Most companies report their own FCF figure in earnings releases. If your number differs by more than 5%, you've got a definitional gap — usually around capitalized software or acquisition-related items. Reconcile, don't paper over.
A 60-second exercise to internalise the concept: open NVDA's most recent 10-K via PickSkill, ask "show me FCF for the last 4 fiscal years and explain the year-over-year change". You'll see how each year's OCF and capex moved, with the underlying line items linked back to the filing.
FCFF vs FCFE — which one to use
| Flavour | What it represents | Discount it at | Use when |
|---|---|---|---|
| FCFF | Cash to all capital providers (equity + debt) | WACC | Standard sell-side equity DCF |
| FCFE | Cash to equity holders only, after interest and debt service | Cost of equity (Re) | LBO models, financial-services valuation, recap-driven theses |
The default in 90% of equity research is FCFF discounted at the WACC, giving you an enterprise value. Subtract net debt and you have an equity value; divide by shares for an implied share price.
FCFE is structurally less common because it requires modelling the company's debt schedule explicitly — every year's interest expense, repayments, and new issuance. In an LBO, that's the whole point. In a typical equity research DCF, FCFF is cleaner.
Common pitfalls that bend tech-company models
Modern tech companies are where FCF analysis goes wrong most often. Four traps to know:
- Treating SBC as non-cash. Stock-based compensation is a real cost — the company is handing equity to employees who would otherwise demand cash salary. GAAP adds SBC back in operating cash flow (it's non-cash); most analysts then forget to model the dilution that the equity grants cause. Result: an "FCF margin" that's 5–15% too high. Fix: either subtract SBC from FCF, or model share count growth explicitly so per-share value reflects the dilution.
- Capitalized software development costs. Many SaaS companies capitalize a portion of engineering salaries under "internal-use software" (ASC 350-40). That cost moves from OCF (where it would lower cash from operations) to capex (where it lowers FCF). Both routes hit FCF — but if you're comparing two companies and one capitalizes aggressively and the other doesn't, the FCF comparison is apples-to-oranges. Normalise by adding capitalized software back.
- Working-capital tailwinds in growth mode. A hyper-growth company collecting cash from customers (deferred revenue) faster than it's spending it has working-capital releases that flatter OCF. That's real cash — it's not wrong — but it's not sustainable when growth slows. Model working-capital changes as a function of revenue growth, not as a constant.
- Capex policy changes. A maturing SaaS shifting from owned data centres to public cloud should see capex fall — that's structural, not earnings management. A struggling company "deferring capex" to hit a quarterly FCF target is masking trouble. Look at capex as % of revenue over 3–5 years, not in isolation.
FCF yield: the one ratio worth caring about
Among the dozen FCF-derived ratios analysts use, FCF yield is the most directly comparable to the bond market and to other equities:
FCF yield = FCF per share / share price
It's the cash return an equity holder would receive if all FCF were distributed (it isn't, in practice — companies reinvest, buy back stock, or sit on cash). But it's the right benchmark against the risk-free rate.
| FCF yield | Reading |
|---|---|
| >8% | Cheap by historical norms; often a value name or a name with concerns priced in |
| 4–8% | Reasonable for steady-state large caps |
| 1–4% | Premium valuation; pricing in growth or unique positioning |
| <1% | Either deeply growth-priced or capex-heavy with no leftover cash for shareholders |
Always compare against the company's own history (is yield expanding or compressing?) and against same-industry peers — software FCF yields look different from utility FCF yields, and that's structural, not signal.
How PickSkill builds FCF on demand
Open a chat and type:
"Pull FCF for AMD for the last 4 fiscal years and explain the year-over-year change."
PickSkill grabs the latest 10-K plus the trailing four 10-Qs from SEC EDGAR, extracts OCF and capex line by line, computes FCF for each year, and shows you the YoY bridge with each material change linked back to the underlying disclosure. Want FCFE instead? Add "...also show FCFE assuming the current debt schedule" — same workflow, just adds net borrowing.
This FCF series is what feeds the DCF tool; the WACC tool supplies the discount rate.
FAQ
What's the difference between FCF and net income? Net income is GAAP profit — what's left after all expenses including non-cash items like depreciation. FCF is the actual cash generated, after the company has paid for the capital required to maintain operations. They can diverge by 30–50% in capital-intensive sectors, or persistently positive net income with negative FCF in fast-growing companies that are reinvesting heavily.
Why is FCF sometimes negative? Three reasons, in order of severity. (1) The company is growing — spending more capex than its current cash flow can fund (Amazon for most of its first decade). (2) Working capital is consuming cash — usually inventory build-up or slower receivables. (3) The business is structurally unprofitable — operating cash flow itself is negative. Identifying which one matters: the first is a deliberate investment decision; the third is an existential problem.
Is FCF the same as EBITDA? No. EBITDA is earnings before interest, taxes, depreciation, and amortization — a proxy for operating cash flow that ignores all three of: working-capital changes, capex, and taxes. FCF accounts for all three. EBITDA is useful for cross-company comparability of operations; FCF is what valuation actually discounts.
Should I look at FCF or EPS for tech stocks? Both. EPS tells you the GAAP profit-per-share narrative the company wants to tell. FCF (after honest SBC treatment) tells you what's actually available to a shareholder. The most useful single chart in a tech-stock analysis is FCF margin and EPS growth side by side over 5 years — when they diverge persistently, that's where the interesting question is.
How does PickSkill source FCF data? Direct extraction from SEC EDGAR filings (10-K, 10-Q) via PickSkill. Operating cash flow and capex come straight from the cash flow statement; the figure is reconciled against the company's own non-GAAP FCF release (where one exists) and the source line items are linked. No third-party data middleman, so the numbers match the filing.