Technical vs Fundamental Analysis — Which One Actually Works?
Technical analysis trades patterns in price and volume; fundamental analysis values the underlying business. Side-by-side comparison and how to combine them.
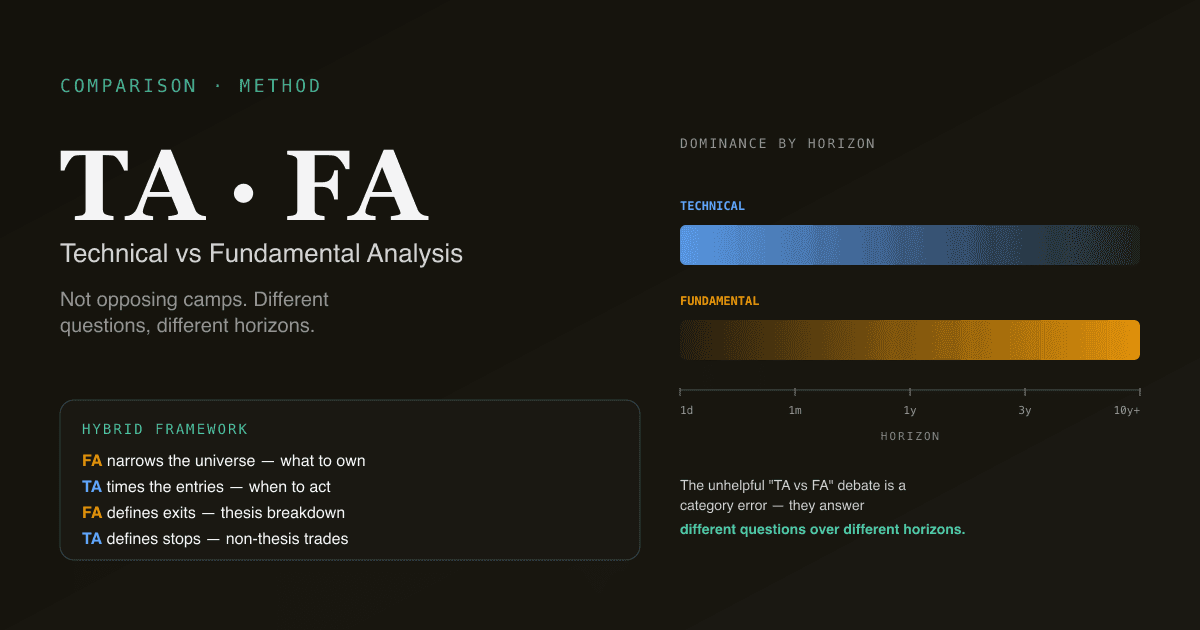
Technical analysis (TA) reads price and volume to forecast where price is going next. Fundamental analysis (FA) values the underlying business to decide whether the current price is too high or too low. They are not opposing camps despite the marketing — they answer different questions over different time horizons, and the most durable investing frameworks use both. The unhelpful "TA vs FA" debate is a category error; the productive question is "which one when?"
Key takeaways
- TA is about when; FA is about what. TA tells you the market's current opinion of a stock; FA tells you what the stock should be worth.
- The horizons differ. TA dominates day-to-day and week-to-week price action; FA dominates multi-quarter and multi-year returns.
- Both have evidence behind them. Momentum and value have been documented as persistent factors for 50+ years; TA's signal-to-noise is highest at the timeframes FA can't speak to.
- Hybrid frameworks beat either alone. "FA for what to own, TA for when to act" is the framework most professional investors converge on after the dogma fades.
- The PickSkill platform supports both — DCF / WACC / 10-K reading tools for fundamentals, /indicators for technicals, with both grounded in the same chat interface.
What is technical analysis really doing?
TA examines historical price and volume to identify patterns that have repeated often enough to be useful as forward signals. The underlying claim: market participant behaviour creates patterns in price; those patterns reflect the cumulative psychology and order-flow dynamics of all participants; some of those patterns persist enough to be tradeable.
TA tools fall into four broad categories:
| Category | Examples | Question answered |
|---|---|---|
| Trend | Moving averages, ADX | Is there a trend? Which direction? How strong? |
| Momentum | MACD, RSI, KDJ | Is the trend accelerating or decelerating? |
| Volatility | Bollinger Bands, ATR | How wide are the price swings? |
| Participation | Volume, capital flow | Is the move backed by real volume? |
TA's strongest empirical evidence sits at the trend / momentum end. Momentum effects (winners keep winning over 3–12 month horizons) have been documented across markets and decades — Jegadeesh-Titman 1993, Asness-Moskowitz-Pedersen 2013, and many replications since. Pattern-based TA (head-and-shoulders, flags, triangles) has weaker out-of-sample evidence; trend and momentum have substantial out-of-sample evidence.
What is fundamental analysis really doing?
FA values the underlying business — earnings, cash flows, growth, balance sheet strength, competitive position, management quality — and compares that intrinsic value to the current market price. The underlying claim: in the long run, stock prices converge toward business value; identifying mispriced businesses delivers durable returns.
FA tools cluster around three approaches:
| Approach | Examples | Question answered |
|---|---|---|
| Absolute valuation | DCF, DDM | What is this business worth on its own cash flows? |
| Relative valuation | P/E, EV/EBITDA | How does this business compare to peers and history? |
| Quality / health | Margin trends, balance sheet ratios, free cash flow | Is the business strong enough to support the multiple? |
FA's strongest empirical evidence sits at the value / quality end. Value investing (buy below intrinsic worth, hold for years) has produced multi-decade outperformance across markets, despite recent cycles where growth dominated value. Quality (high-margin, low-debt, returns-on-capital businesses) has held up even when raw value lagged.
Where each approach has its edge
| Question | Better answered by |
|---|---|
| "Is this stock going up tomorrow?" | TA (FA has no view on this) |
| "Will this trend continue another month?" | TA (momentum, trend strength) |
| "Where is a good entry on a stock I already want to own?" | TA (pullback to support, oversold extreme) |
| "Is this stock cheap relative to earnings?" | FA (relative valuation) |
| "What is this business worth in 5 years?" | FA (DCF, scenario analysis) |
| "Will this company survive a recession?" | FA (balance sheet, cash flow durability) |
| "Should I hold this for 10 years?" | FA — TA has nothing useful at this horizon |
| "Is the market in a risk-on or risk-off regime?" | TA (broad index trend, breadth indicators) |
The split is not "which one works" — both work in their respective domains. The split is "which one for which question."
The horizon argument
The cleanest mental model for combining the two: TA dominates short horizons; FA dominates long horizons.
- 1 day to 1 week: TA. FA has no view at this horizon. Price action, momentum, and participation drive the move.
- 1 month to 3 months: TA still leads. Momentum factors deliver their strongest signal in this range. Fundamental news matters but is mostly priced in already.
- 3 months to 12 months: Both contribute. Earnings revisions begin to dominate; technical patterns lose precision.
- 1 year to 5 years: FA leads. The business's actual cash flows and competitive position drive the bulk of the return; technical patterns become noise.
- 5+ years: FA dominates entirely. Patient capital that owns good businesses produces multi-year compound returns largely independent of entry-point technicals.
A retail investor who only trades 1-week windows but ignores FA will trade noise. A retail investor who only buys based on FA but ignores TA at entry will routinely pay 15–25% premiums over the price the same business would offer six weeks later on a typical pullback.
How to combine them in a real workflow
The framework that most professional investors converge on after years of practice:
- FA narrows the universe. Apply a fundamental screen (quality, valuation, growth) to identify a watchlist of 20–50 names worth owning. This is the "what to own" filter — and it is mostly time-invariant.
- TA times the entries. Within the FA-approved watchlist, use technical tools to time entries — wait for pullbacks to support, oversold momentum readings, or breakout confirmations. This is the "when to act" filter.
- FA defines exits. Sell on fundamental thesis breakdown (revenue growth stalling, margin deterioration, balance sheet weakness, governance issues) rather than on technical signals. Technical-based exits in long-term positions routinely sell during ordinary 20% drawdowns that the position eventually recovers from.
- TA defines stop levels for non-thesis trades. For positions taken without a fundamental thesis (speculation, swing trades), TA-based stops are the right discipline. Without FA backing, you have no anchor for "is this still worth holding through a drawdown?"
This is the framework PickSkill is built to support — the /chat interface for fundamental work (DCF, 10-K reading, peer comparison, valuation), the /indicators dashboard for technical work (trend regime, momentum, entry timing), and the same underlying data for both.
Four pitfalls in the TA / FA debate
- Choosing dogma over evidence. Both approaches have multi-decade empirical backing in their respective domains. The "technical analysis is astrology" camp ignores 50 years of momentum literature; the "charts don't matter" camp ignores how badly value strategies have suffered when applied without entry-timing discipline. Use what works for the question you are asking.
- Applying one to the other's domain. Don't use TA to decide what to own for 5 years; don't use a DCF to decide whether to buy this Friday. Each tool has its horizon; respecting the horizon avoids the wrong-tool-for-the-job failures that produce the worst outcomes.
- Mixing them without a framework. "I bought because the chart looked good and the company seems fine" is not combining TA and FA — it is missing both. Define which tool answers which question in your process, and stick to that discipline.
- Over-trading the technical layer. TA generates more signals than FA does. A position taken on fundamentals can be over-managed via technical signals to the point that the fundamental thesis never has time to play out. Slow down the technical layer when the fundamental thesis is the primary driver.
How TA and FA behave on A-shares vs US stocks
The structural differences matter:
- A-shares: retail-dominated flow makes technical patterns more reliable in the short term (the cultural coordination on KDJ, MACD, and round-number support is stronger). Fundamental signals work but operate against a higher noise floor — sentiment-driven moves can overwhelm fundamental signals for quarters.
- US large-caps: institutional flow dampens technical pattern reliability slightly (more sophisticated participants front-run obvious patterns). Fundamental signals have a longer reliable history; quality factors deliver consistent multi-decade outperformance.
- HK names: mixed. The flow is split between mainland southbound, foreign institutional, and local retail — each respond to different signals.
See Best Indicators for A-shares for the technical-side market-specific playbook, and What Is DCF? for the absolute-valuation foundation.
Run both on your portfolio. The PickSkill /chat interface handles fundamentals (DCF, 10-K reading, peer comparison); the /indicators dashboard handles technicals (trend, momentum, entry timing). Both surfaces share the same data and the same chat-based workflow.
Further reading
- Eugene Fama, Random Walks in Stock Market Prices — the foundational paper articulating the efficient-market position against TA.
- Jegadeesh & Titman, Returns to Buying Winners and Selling Losers — the canonical momentum-factor evidence.
- Benjamin Graham, The Intelligent Investor — the foundational value-investing reference.
FAQ
Which one should a beginner start with? Fundamentals — specifically valuation basics (P/E, EV/EBITDA, FCF) and how to read a 10-K. Understanding what a business is worth before reading its chart prevents the most expensive beginner mistakes (chasing momentum into businesses that don't deserve the multiple). Once you can value a business, add technicals to time entries and define risk.
Is technical analysis actually scientific? Parts of it. Trend and momentum factors have been documented in peer-reviewed finance literature for 50+ years; the empirical evidence is robust. Pattern-based TA (head-and-shoulders, flags, Elliott waves) has much weaker out-of-sample evidence and is closer to folklore than science. The scientific defensibility scales with how mechanically the signal is defined.
Can I make money with technical analysis alone? Yes, with caveats. Systematic momentum strategies have delivered risk-adjusted returns net of costs across decades. Discretionary TA — eyeballing charts, drawing trendlines, reading patterns — has a much worse empirical record because the human pattern-recognition apparatus over-fits to noise. Mechanical TA works; discretionary TA mostly does not.
Can I make money with fundamental analysis alone? Yes, with caveats. Value and quality factors have delivered long-run outperformance across markets. The catch is the variance — value strategies have endured 5–10 year underperformance periods that test even disciplined investors. Pure FA without entry timing routinely sits through 30%+ drawdowns that the underlying business eventually rewards.
Why do most professional investors use both? Because the markets answer different questions over different horizons, and no single framework dominates across all horizons. The combination — FA for what to own, TA for when to act and how to size — gets the best of both. The dogma of "TA only" or "FA only" exists mostly in retail and academic discourse; the practitioner consensus is hybrid.