What Is Capital Flow? Money-Flow Indicators, Explained
Capital flow measures whether money is entering or exiting a stock on a given bar — using price-direction-weighted volume. MFI, CMF, OBV — formulas, uses, pitfalls.
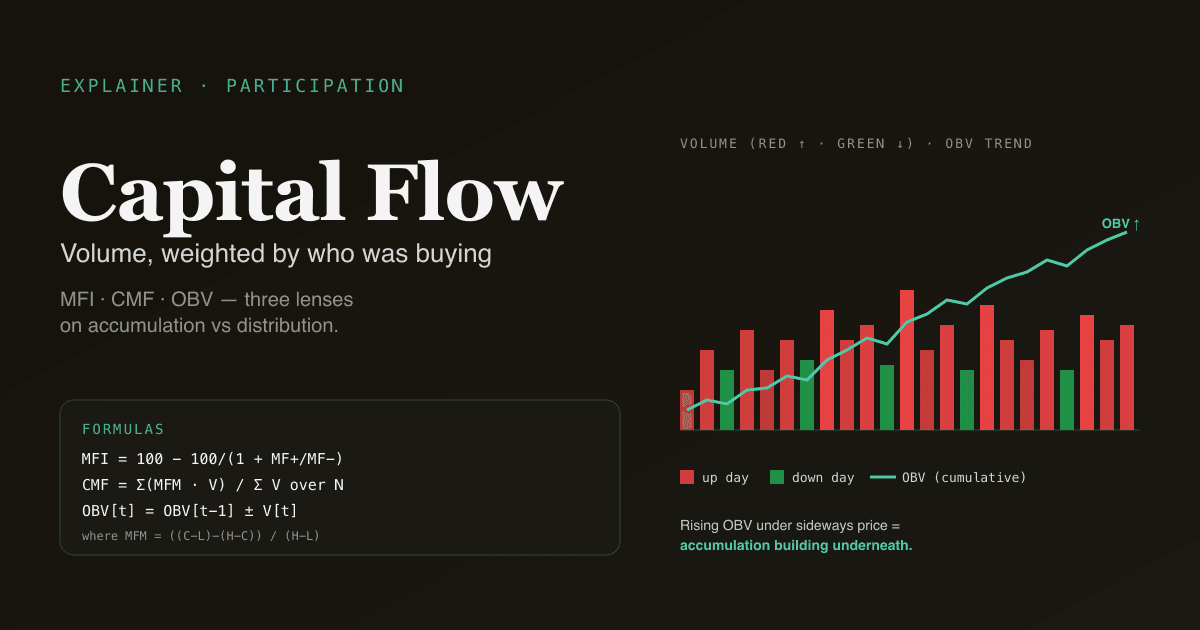
Capital-flow indicators combine price direction with volume to estimate whether money is entering a stock (accumulation) or exiting (distribution). Plain volume tells you how much traded; capital-flow tools tell you whose side the volume was on. Done right, they catch the early stages of accumulation before price has moved enough for trend tools to register. Done casually, they are easy to over-trust — flow is one signal among several, not a verdict.
Key takeaways
- Three indicators dominate: MFI (Money Flow Index), CMF (Chaikin Money Flow), and OBV (On-Balance Volume). Each weighs volume by price direction in a slightly different way.
- The core idea: a green bar with heavy volume = net buying pressure; a red bar with heavy volume = net selling. Sum across bars to get a cumulative pressure series.
- Capital flow's blind spot: it cannot distinguish between large institutional flow and aggregated retail flow on the same volume bar. Modern markets blur the distinction further.
- The highest-value use is divergence: when price makes a new high but flow does not (or vice versa). See What is divergence?.
- Renders on every holding — the PickSkill /indicators flow dashboard surfaces MFI and CMF readings plus a 5-day flow-trend bucket so you can see whether accumulation is building or fading.
How does capital flow get calculated?
Three commonly used formulations, each making a slightly different assumption about how to weigh volume by price action.
Money Flow Index (MFI)
A volume-weighted RSI. Range 0–100; overbought >80, oversold <20.
Typical Price (TP)   = (High + Low + Close) / 3
Raw Money Flow (RMF) = TP × Volume
Positive Money Flow  = Sum of RMF over N bars where TP rose
Negative Money Flow  = Sum of RMF over N bars where TP fell
Money Flow Ratio     = Positive MF / Negative MF
MFI                  = 100 − [100 / (1 + Money Flow Ratio)]
Default N = 14. MFI is the most popular flow indicator because the 0–100 scale is familiar (it reads like RSI) and the overbought / oversold thresholds map intuitively.
Chaikin Money Flow (CMF)
Weighs each bar's volume by where the close sat within the bar's range. Bars closing near the high get positive weight; bars closing near the low get negative weight.
Money Flow Multiplier (MFM) = ((Close − Low) − (High − Close)) / (High − Low)
Money Flow Volume (MFV)     = MFM × Volume
CMF                         = Sum(MFV, N) / Sum(Volume, N)
Default N = 20. CMF runs from −1 to +1; values above +0.05 indicate buying pressure; below −0.05 indicate selling. CMF's strength is bar-by-bar precision (each bar's flow is determined entirely by where it closed within its range); its weakness is sensitivity to one-off wide-range bars.
On-Balance Volume (OBV)
The simplest of the three, and arguably the most robust:
If Close[t] > Close[t-1]: OBV[t] = OBV[t-1] + Volume[t]
If Close[t] < Close[t-1]: OBV[t] = OBV[t-1] − Volume[t]
Else:                     OBV[t] = OBV[t-1]
OBV is a cumulative series — it has no absolute meaning; what matters is its direction relative to price direction. When OBV trends up while price chops, accumulation is building underneath; when price makes new highs but OBV does not, the rally is happening on weakening participation.
The three indicators agree most of the time. When they disagree, OBV is usually the cleanest read on whether net volume is supporting the price move.
What does capital flow actually tell you?
Three real use cases, in order of edge:
- Detecting accumulation before price moves. Stocks at the end of a downtrend often show flow indicators turning up before price has confirmed a bottom. The pattern: OBV bottoms and starts trending up while price is still grinding sideways. This is one of the cleaner setups for "buying before the breakout" — though it routinely takes weeks to play out, and many candidates do not produce price follow-through.
- Confirming a breakout. A price breakout on weak flow (CMF near zero, no OBV new high) is more likely to fail than a breakout on strong flow (CMF spiking positive, OBV punching to a new high). Treat flow as confirmation: required for high-conviction entries, optional for opportunistic ones.
- Identifying flow divergence. Price makes a higher high; flow makes a lower high. This is bearish divergence on capital flow specifically — different from MACD or RSI divergence, and sometimes earlier. Hidden bullish flow divergence (price higher low, flow lower low in an uptrend) catches trend resumption that pure-price tools miss.
The use case that does not work as well as commonly believed: predicting absolute tops and bottoms in real time. Flow signals are noisier at extremes than at transitions; the cleaner read is at the transition (downtrend → consolidation) rather than at the extreme (peak of an uptrend).
What does flow miss?
Three structural blind spots worth knowing before you over-trust the signal:
- Cannot distinguish institutional from retail flow. A 10% volume spike could be one institutional buyer accumulating or 10,000 retail trades. The flow indicator treats both identically. For names with heavy options-related hedging flow (large-cap tech especially), this distortion is non-trivial — option dealer hedges can dominate daily flow without reflecting fundamental conviction.
- Cannot see dark-pool / off-exchange volume. Modern US equity markets transact 30–50% of volume off-exchange. Public-tape flow indicators only see lit-market volume. The signal is still real (lit-market flow correlates with off-exchange flow), but the absolute readings are not the full picture.
- Sensitive to gap days. Earnings gaps, news gaps, and overnight halts produce one-bar volume spikes that dominate the indicator for the next N bars. The 14-bar MFI takes 14 sessions to fully discount a single anomalous gap.
The PickSkill flow dashboard explicitly flags gap-day bars and limit-day bars (for A-shares) as outliers; the smoothed flow readings exclude them from the rolling window to keep one-off events from dominating the read.
Four pitfalls in interpreting flow signals
- Reading the absolute level instead of the trend. "MFI is 65" is barely informative. "MFI has risen from 35 to 65 over the last 8 bars while price has been flat" is the same number but a much stronger signal. Flow indicators are most useful via their slope and trajectory, not their snapshot value.
- Confusing volume with flow. A heavy-volume up day is bullish; a heavy-volume down day is bearish. Volume alone is neutral; it amplifies whatever direction the bar happened to close in. Flow indicators are volume weighted by direction — that weighting is the entire information content. If you only look at volume bars without the direction overlay, you are not looking at flow.
- Ignoring market-wide flow context. A stock with rising OBV during a market-wide selloff is more informative than a stock with rising OBV in a market-wide rally — in the former, real conviction is building against the tide; in the latter, the flow is just market beta. Always check flow against broader market flow.
- Trading flow without a price-action trigger. Flow turning up does not mean buy; it means "watch for a buy trigger." Wait for a price-action confirmation (breakout above a level, MA cross, MACD turn) before sizing in.
How capital flow behaves on A-shares
The A-share market has additional flow dynamics worth understanding:
- Northbound / Southbound flow (Stock Connect inflows from Hong Kong) is a separate, publicly disclosed flow series. It is not the same as on-tape MFI / CMF / OBV — it specifically captures foreign institutional flow via the connect channel. Many local platforms aggregate this into a "北向资金净流入" indicator that is informational about who is buying, not just how much volume traded.
- Day-trading restrictions (T+1) compress flow signals. Because A-share investors cannot sell same-day, daily volume is heavily skewed toward initial purchases — overnight risk is held, not unwound. This makes A-share OBV more directional than US OBV but also more prone to one-day herding spikes.
- Limit-up days truncate flow. When a stock locks at limit-up, the volume on the order book may be enormous but the executed volume is small. Most data feeds report the executed volume; flow indicators using executed volume understate true demand on limit days. Trade limit-day flow signals with caution.
See Best Indicators for A-shares for the broader playbook.
Track flow on your holdings. The /indicators flow dashboard renders MFI and CMF for every position, surfaces the 5-day flow-trend bucket, and explicitly flags accumulation patterns (rising OBV during sideways price) and distribution patterns (falling OBV during rising price).
How flow fits in a multi-signal workflow
Flow is the participation layer — it answers "is the volume supporting the move?" That layer slots into a wider stack:
| Layer | Tool | Question |
|---|---|---|
| Trend | MA stack, ADX | Direction? Strength? |
| Momentum | MACD, RSI | Recent direction of change? |
| Participation | MFI, CMF, OBV | Is the move backed by volume? |
| Volatility | Bollinger Bands | Is the move proportionate? |
| Map | Support / resistance | Where are the key levels? |
Use the participation layer to confirm signals from the other layers, not to generate signals on its own. A bullish setup with rising OBV, MACD golden cross, and price above the 50-day MA is materially higher-conviction than any of those alone.
Further reading
- Marc Chaikin's Money Flow paper — the developer's own treatment of CMF and the persistency-of-money-flow theory.
- Joseph Granville, New Strategy of Daily Stock Market Timing — original OBV reference; methodology section is still worth reading.
FAQ
Which flow indicator should I use? Start with OBV — it is the simplest and most robust. Use MFI when you want a bounded 0–100 reading like RSI. Use CMF for bar-by-bar precision when you care about how each individual bar closed within its range. The three agree most of the time; when they disagree, OBV is usually the cleanest signal. The PickSkill flow dashboard surfaces all three.
Is "smart money flow" the same as capital flow? "Smart money flow" is a marketing term, not a technical definition. Most "smart money" indicators are repackaged versions of OBV / MFI / CMF, sometimes with a time-of-day weighting (late-day volume gets more weight on the theory that institutions trade into the close). The underlying signal is the same family; the branding varies.
Can capital flow predict where a stock is going? Predict is too strong. Capital flow can tell you whether the current move is well-supported by volume (raising the probability of continuation) or poorly supported (raising the probability of failure). It cannot tell you direction in isolation — flow flatlines through long sideways periods and produces false signals during news-driven gaps. Treat it as a confidence modifier on signals from other tools, not as a directional forecast.
Why does flow look different on different platforms? Three causes: (1) different N values (14 vs 21 for MFI; 20 vs 21 for CMF), (2) different handling of pre-market / after-hours volume (some include extended hours; PickSkill uses regular-session only for consistency), (3) different gap-day handling. For consistency, PickSkill uses regular-session volume, excludes limit-day bars (A-shares), and applies a single set of default N values across all holdings.
How does flow interact with options-related hedging? On heavily optioned large-caps, dealer hedging can drive 20–40% of daily flow without reflecting fundamental conviction — a stock with rising gamma exposure forces dealers to buy on up-days and sell on down-days, which inflates flow readings in both directions. For names with heavy options activity, flow signals are less informative than for less-optioned names; pair flow with implied-volatility skew and gamma-exposure data for a complete read.