What Is Divergence? Bullish, Bearish, and the Hidden Variant Retail Misses
Divergence is when price and an indicator disagree on direction. Definition, the 4 standard types, why most divergences fail, and how to filter the ones that don't.
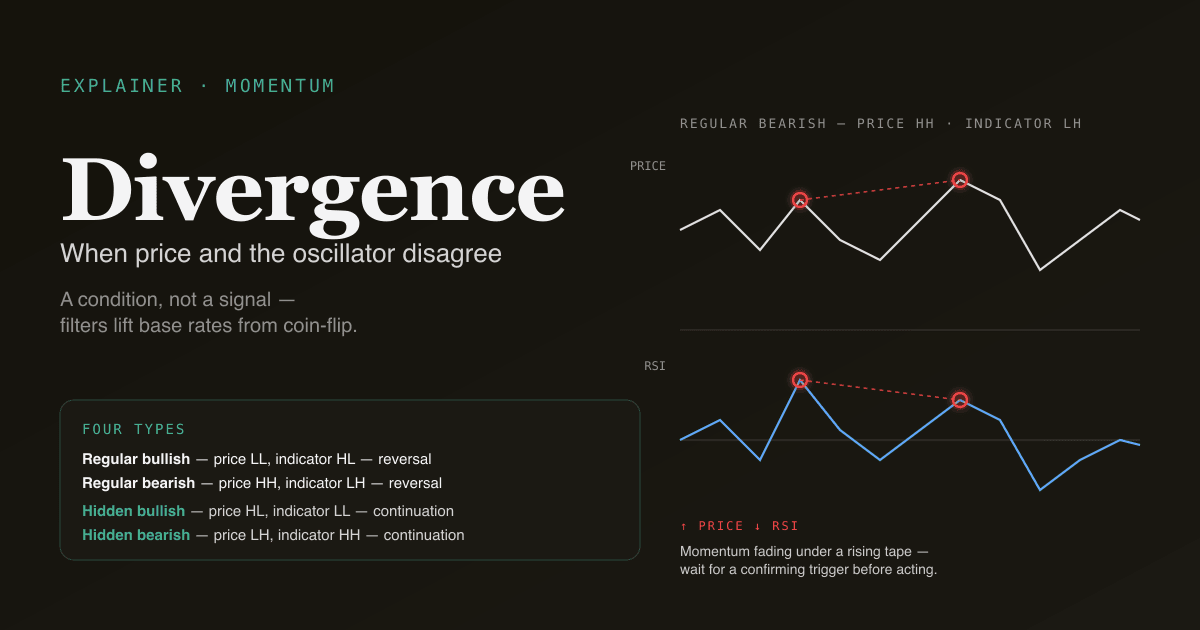
Divergence is the technical pattern where price and an oscillator (MACD, RSI, KDJ, OBV) move in opposite directions over the same swing. Price makes a higher high while the indicator makes a lower high — or price makes a lower low while the indicator makes a higher low. The underlying message: the move you see on the chart is no longer being confirmed by the momentum (or volume, or breadth) that drove it. Most retail readers treat divergence as a reversal trigger. Backtests say that is the wrong framing — it is a warning, not a signal.
Key takeaways
- Four standard types: regular bullish, regular bearish, hidden bullish, hidden bearish. The "regular" pair are reversal warnings; the "hidden" pair are trend-continuation signals.
- The single biggest mistake retail readers make: treating divergence as a standalone entry trigger. The base-rate hit rate on bare regular divergence is around 35–45%, depending on market and timeframe.
- Divergence becomes useful when filtered: confirmed by a momentum cross, supported by volume context, and respecting the underlying trend regime (ADX > 25).
- Hidden divergence is under-taught and arguably more reliable — historical data suggests trend-continuation setups outperform reversal setups on simple metrics like 5- and 20-day forward returns.
- The PickSkill /indicators divergence dashboard scans every holding for the four divergence types across MACD, RSI, and KDJ — surfacing only the cases where the swing pivots are well-defined.
How is divergence defined precisely?
Divergence requires two swing points in price and two corresponding swing points in the indicator. The "swing point" must be a confirmed pivot — not just any local high or low, but one with at least N bars on each side that fail to exceed it (N is typically 3–5 on daily bars).
Given two confirmed price pivots and two confirmed indicator pivots over the same window, four cases exist:
| Type | Price | Indicator | Implication |
|---|---|---|---|
| Regular bullish | Lower low | Higher low | Downtrend losing momentum — reversal candidate |
| Regular bearish | Higher high | Lower high | Uptrend losing momentum — reversal candidate |
| Hidden bullish | Higher low | Lower low | Uptrend pullback complete — continuation candidate |
| Hidden bearish | Lower high | Higher high | Downtrend bounce complete — continuation candidate |
The "regular" variants are the ones every introductory technical-analysis book covers. The "hidden" variants are mathematically symmetric but get a tiny fraction of the attention.
Why does divergence fail so often?
The mechanical reason: indicators are derived from price. MACD is the difference of two EMAs of close. RSI is a normalised function of recent up-closes vs down-closes. When price makes a new extreme but the indicator does not, the indicator is telling you that recent price changes were smaller in magnitude than the price changes that drove the previous extreme. That is informational — momentum is fading. But fading momentum is not the same as a reversal. Markets can grind in fading momentum for weeks without reversing.
The empirical reason: divergence base rates are not as strong as guides claim. Across diverse markets and timeframes:
- Regular bullish divergence signal-to-reversal hit rate: ~35–45% on daily bars without filters.
- Regular bearish divergence: similar range, slightly higher in bear markets where the "false rallies" produce frequent failures.
- Hidden divergence: 50–60% on daily bars in clearly trending regimes; closer to coin flip in choppy markets.
The numbers improve materially with filters. The numbers degrade materially in low-volatility chop. The fact that most retail guides quote "70%+ accuracy" for divergence reflects survivorship bias in the examples they show — not what the signal actually delivers.
What filters make divergence actually work?
Three filters, applied in combination, lift divergence from coin-flip territory to a usable component of a multi-signal system:
-
Trend regime filter. Divergence on a momentum oscillator requires a trending market for the underlying mechanism (momentum exhaustion) to make sense. When ADX is below 20, the market is range-bound and divergence is just two random pivots — ignore it. When ADX is above 25, divergence has a real signal-to-noise advantage.
-
Confirmation event. Divergence is a condition not a signal. Wait for a confirming event — a MACD line cross, an RSI cross out of the extreme zone, or a price break of a structural level — before acting on the divergence. The condition tells you which side to take; the confirmation tells you when.
-
Volume / participation confirmation. Divergence is most reliable when the swing that should be making the higher high (in the bearish case) is doing so on declining volume. If the new price high prints on heavy volume, the divergence is more likely to fail — heavy buying is not the signature of an exhausting uptrend.
Applied together, these filters reduce the number of divergence setups by 60–80% but lift the per-setup hit rate substantially. The trade-off is fewer trades; the upside is a lot less noise.
What is hidden divergence — and why does it deserve more attention?
Hidden divergence is the trend-continuation cousin of regular divergence. The pivots invert:
- Hidden bullish: in an uptrend, price makes a higher low (pulls back but holds the prior swing low) while the indicator makes a lower low (deeper pullback in momentum than the price suggests). Interpretation: the pullback is complete, the trend resumes.
- Hidden bearish: in a downtrend, price makes a lower high (rallies but fails the prior swing high) while the indicator makes a higher high (stronger bounce in momentum than the price suggests). Interpretation: the bounce is over, the downtrend resumes.
Why it matters: hidden divergence catches the resumption of established trends, which is statistically the higher-edge opportunity in trending markets. Regular divergence tries to catch the end of trends, which is statistically harder. Most trend-following research (Faber, Asness, Moskowitz) finds the persistence of trends is the more reliable phenomenon than the timing of their reversal.
The PickSkill top divergence dashboard surfaces all four types across MACD, RSI, and KDJ — explicitly labelling hidden variants so they get the attention they deserve.
Four pitfalls in reading divergence
- Drawing the pivots after the fact. Divergence is easy to spot in hindsight on a chart where the eye knows where the swings will be. The discipline is identifying pivots in real time using a fixed rule (e.g. confirmed-pivot = no higher / lower point in the next N bars). Hindsight pivots will not match real-time pivots.
- Using divergence on choppy stocks. Low-momentum, high-noise tickers generate hundreds of "divergences" that are just two random pivots in noise. Restrict divergence analysis to names with reasonable trend persistence — the same names where MACD and other momentum tools work.
- Ignoring the magnitude of divergence. A 2-bar lower high in price against a 5-bar higher high in MACD is one kind of divergence; a 50-bar deeply negative MACD swing against a marginally lower price swing is a much stronger one. The size of the disagreement is informational, not just the existence of it.
- Confusing divergence with overbought / oversold. RSI > 70 is overbought. RSI making a lower high while price makes a higher high is bearish divergence. The two often coincide but are not the same — overbought is a static condition; divergence is a pattern in pivots.
How divergence behaves on A-shares
The mechanics are identical, but the market microstructure changes which divergences are real:
- Daily limits truncate swings. Limit-up days cap the day's range at the limit price, which means the price pivot is artificial — it is not where the market would have settled in a free-trading session. Divergence built on a limit-day pivot is mechanically suspect; the PickSkill dashboards exclude limit-day bars from pivot detection.
- Halts create false pivots. When a stock is halted for days then resumes, the resumption gap looks like a sharp pivot but is actually a price discovery event after a freeze. Treat post-halt divergence with extra scepticism.
- Higher-volatility regime. A-shares trade with materially higher daily volatility than US large-caps. The "noise floor" for pivot detection is higher; require larger pivots (N=5 vs N=3 on daily bars) to filter out micro-swings.
For the broader market-by-market comparison see Best Indicators for A-shares.
Find divergences on your portfolio. The /indicators dashboard scans every holding for the four divergence types across MACD, RSI, and KDJ — surfacing only swings where the pivots are well-defined.
How divergence fits in a multi-signal workflow
Divergence is a watchlist trigger, not an entry trigger:
| Stage | Tool | Question answered |
|---|---|---|
| 1. Filter | ADX > 25, MA stack aligned | Is there a real trend to fade or follow? |
| 2. Setup | Divergence in a momentum oscillator | Is the trend showing exhaustion (regular) or resumption (hidden)? |
| 3. Trigger | MACD cross, RSI cross of 50, price break of pivot | When to act? |
| 4. Confirm | Volume / breadth context | Is the move being supported by participation? |
Skip any stage and the divergence is mostly noise. Layer all four and divergence becomes a useful pattern in a structured workflow. See Combining MACD, RSI, and ADX into a 3-indicator filter for a specific layering recipe.
Further reading
- Investopedia on bullish divergence — reference for the standard four types.
- Constance Brown, Technical Analysis for the Trading Professional — practitioner's treatment of momentum divergence with emphasis on hidden variants.
FAQ
Is bullish divergence a reliable buy signal? On its own, no — historical hit rates are in the 35–45% range for bare regular bullish divergence on daily bars. The signal becomes useful when filtered: trend regime (ADX > 25), confirmation event (MACD cross or RSI exit from oversold), and volume / breadth alignment. Apply all three and the hit rate lifts to a workable range. Skip them and you are trading noise.
Which indicator gives the best divergence signals? There is no single best indicator. MACD divergence has more structure (the histogram amplifies the disagreement); RSI divergence is cleaner at extremes (>70 / <30); KDJ divergence is most popular in the A-share retail community. The PickSkill divergence dashboard scans all three so you can compare. In practice, divergence that shows up in two of three oscillators simultaneously is materially more reliable than divergence in any one alone.
Why don't I see hidden divergence covered in most trading books? Two reasons: (1) it is mathematically the harder pattern to spot (the pivots invert), and (2) trend-continuation patterns are less narratively satisfying than reversal patterns ("catching the bottom" sells more books than "buying the dip"). The data suggests the opposite of the narrative: hidden divergence in confirmed trends is the higher-edge setup. The PickSkill top divergence dashboard explicitly labels hidden variants so they get the attention they deserve.
Can I trade options on a divergence signal? You can, but timing matters. The divergence is a condition; you need a trigger (cross, break, confirm). Buying long-dated calls on divergence with no trigger pays time decay while you wait. The cleaner structure is to wait for the trigger event, then position on the move with appropriate sizing. For a discussion of how to combine divergence with other signals before sizing into an option trade, see Three-indicator filter.
What is the difference between divergence and convergence? Convergence is the absence of divergence — price and indicator moving together. In some literature "convergence" is used to describe the moment a divergence resolves (price catches down to the indicator, or vice versa); in others it just means alignment. The terminological ambiguity is unhelpful — most modern usage uses "divergence" as a pattern and "convergence" as the resolution.