What Is Volume Analysis? The Confirmation Layer Most Retail Skips
Volume measures market participation behind every price move. Why volume confirms breakouts, the 4 volume patterns that matter, and how to read VROC and volume profile.
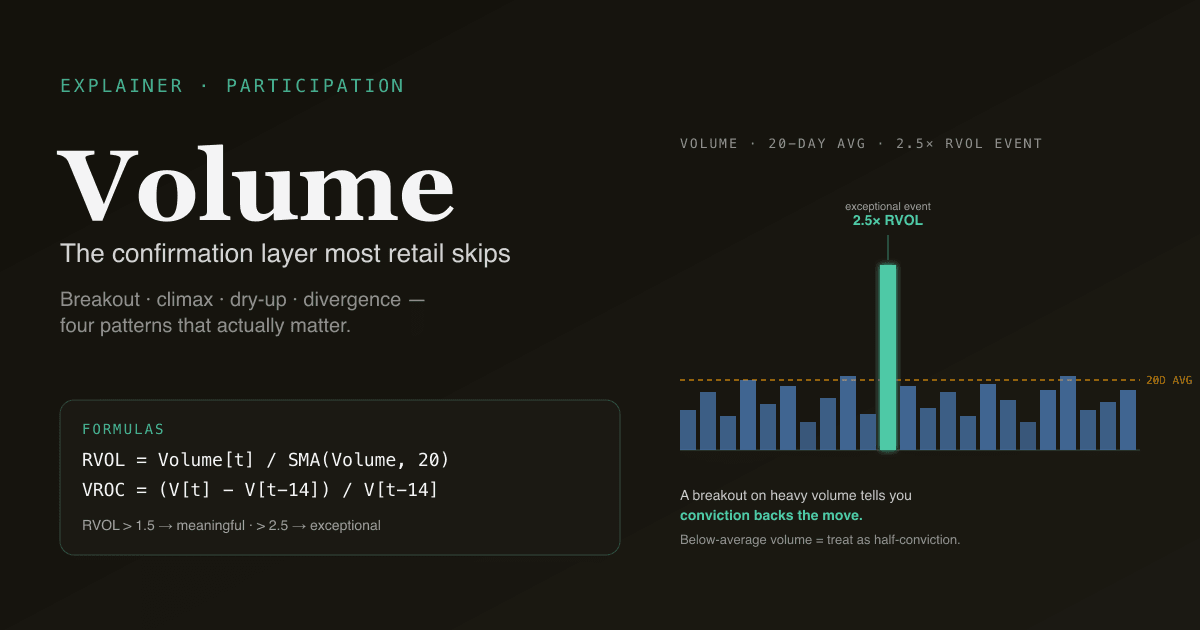
Volume is the number of shares (or contracts) traded in a given bar — and it is the single most under-used data point in retail technical analysis. Price tells you where the market went; volume tells you how many people went with it. A move on heavy volume reflects broad conviction; a move on light volume reflects a handful of participants. The bare price chart can be unanimous about the direction and still mean very little if the volume underneath says nobody showed up.
Key takeaways
- Three patterns dominate the analysis: breakout volume (heavy volume confirms a break), exhaustion volume (extreme volume at the end of a move signals climax), and dry-up volume (volume contracts before a major directional move).
- The base reference is 20-day average volume. A bar at 2× the 20-day average is meaningfully heavy; at 3× it is exceptional. Below 0.5× the average is "no participation" and signals near-zero conviction.
- Volume confirms; it does not lead. A price move backed by volume is more likely to continue. Lack of volume is a yellow flag, not a sell signal.
- Volume's blind spot: it does not distinguish buyers from sellers. Use capital-flow indicators (OBV, MFI, CMF) when you need direction-weighted volume.
- Available on every PickSkill chart — the /indicators volume dashboard surfaces VROC, relative volume, and the 5-day participation bucket for every holding.
What is "normal" volume — and how do you measure it?
Volume is always relative. The same 5M-share bar is a non-event on Apple and an extreme event on a $300M-market-cap micro-cap. Two normalising tools do most of the work:
Relative volume (RVOL)
RVOL = Today's Volume / 20-day Average Volume
A simple ratio. RVOL = 1.0 is exactly average; 2.0 is double; 0.5 is half. The 20-day window smooths out single-bar anomalies while staying responsive to recent regime changes.
| RVOL | Interpretation |
|---|---|
| < 0.5 | Quiet — no participation, signals at this volume are mostly noise |
| 0.5–1.0 | Below average — proceed with normal caution |
| 1.0–1.5 | Normal-to-active — standard conditions |
| 1.5–2.5 | Heavy — meaningful participation; breakouts here tend to follow through |
| > 2.5 | Exceptional — institutional flow, news event, or capitulation in progress |
The PickSkill dashboards surface RVOL on every chart so you can see at a glance whether today's move is happening on real participation or just price drift.
Volume Rate of Change (VROC)
The percent change in volume from N bars ago:
VROC(N) = ((Volume[t] − Volume[t-N]) / Volume[t-N]) × 100
Default N = 14. VROC measures the acceleration of volume rather than its current level — useful for detecting volume regime changes (dry-up before a breakout, surge into a top) that the RVOL ratio captures only after the fact.
What are the four volume patterns that matter?
1. Breakout volume
A breakout (price moving above resistance or below support) on heavy volume — RVOL > 1.5, ideally > 2.0 — has a substantially higher probability of follow-through than a breakout on light volume. The volume tells you the breakout reflects broad participation, not a single buyer accidentally lifting an offer.
The simplest version of this rule beats almost every other technical filter: only act on breakouts that occur on at least 1.5× average volume. This single check eliminates roughly half of all false breakouts.
2. Exhaustion volume (climax)
A 3–5× RVOL bar at the end of a multi-week move, usually accompanied by an unusually wide bar (climax candle), often signals exhaustion — buyer or seller capacity has been spent. Two classic forms:
- Buying climax: at the top of an uptrend, a parabolic bar prints on extreme volume; the move feels euphoric. Often the exact high, sometimes the high for months.
- Selling climax (capitulation): at the bottom of a downtrend, a gap-down bar prints on extreme volume; sentiment is uniformly negative. Often the lowest close before a multi-week rally.
Climaxes are easier to identify after the fact than in real time. The structural pattern (extreme volume + extreme bar + at the end of a long directional move) is a watchlist trigger, not a standalone reversal signal. Wait for confirmation — a reversal bar the next session, or a momentum cross on MACD — before acting.
3. Dry-up volume (the squeeze)
Volume contracting to below-average levels over multiple weeks, often paired with price consolidation in a tight range. This is the "coiling" pattern that frequently precedes major directional moves. The intuition: participation has dried up because nobody can decide the next direction. When a catalyst arrives, the volume comes back at scale and the price moves with it.
Dry-up volume pairs naturally with the Bollinger Band squeeze — both measure the same phenomenon (volatility / participation compression) from different angles. When both align, the probability of an imminent directional move is materially higher.
4. Volume divergence
Price makes a new high; volume on the new-high bar is lower than the prior new-high bar. This is bearish volume divergence — the new high is being made by fewer participants, which historically precedes failure. The mirror pattern (lower lows on declining volume = exhaustion of sellers) is bullish volume divergence.
Volume divergence is more reliable than oscillator divergence at major turning points because it directly measures participation rather than the second-derivative of price. See What is divergence? for the broader framework.
What is volume profile (and is it useful for retail)?
Volume profile is a different way of plotting volume — instead of showing volume per time bar, it shows volume per price level. The result is a horizontal histogram on the right side of the chart: tall bars at price levels where the stock has spent a lot of accumulated volume, short bars where it has spent little.
| Feature | Meaning |
|---|---|
| Point of Control (POC) | The price level with the highest accumulated volume in the window |
| Value Area (VA) | The price range containing 70% of the total accumulated volume |
| Low Volume Nodes (LVN) | Price levels with little accumulated volume — prices tend to move through these quickly |
| High Volume Nodes (HVN) | Price levels with heavy accumulated volume — prices tend to pause or reverse near these |
The POC and HVNs function as a refined form of support / resistance — levels where the market has historically transacted in size. Volume profile is most useful on intraday timeframes for active trading and on longer-term charts (year-to-date, 5-year) for understanding where major levels actually sit.
For most retail readers, daily-bar volume + the standard MA stack + standard support / resistance levels deliver 80% of the value. Volume profile is an upgrade for serious active traders; the basics get you most of the way.
Four pitfalls retail readers fall into
- Ignoring volume entirely. The most common pitfall. A breakout that "looks great" on the price chart but happens on 0.6× average volume is half the signal you think it is. Always overlay volume; treat low-volume signals with default scepticism.
- Equal-weighting all heavy-volume bars. A heavy-volume bar at the start of a move (breakout) is bullish; a heavy-volume bar at the end of a move (climax) is bearish. Same volume, opposite implications. Context — where the volume sits in the trend — is half the information.
- Forgetting which sessions the volume came from. Earnings volume, gap-day volume, and limit-day volume are not the same as normal-session volume. A 4× RVOL bar on earnings day is mostly priced-in noise; a 4× RVOL bar on a non-event day is real conviction. The PickSkill dashboards explicitly flag event-day bars as outliers.
- Conflating volume with capital flow. Volume is direction-neutral — a 3× RVOL down day is bearish volume, not "high participation." Volume amplifies the direction of the bar it sits on. To get directional flow, use capital-flow indicators (OBV, MFI, CMF).
How volume behaves differently on A-shares
A-share volume has structural features that change interpretation:
- T+1 settlement restricts same-day round-trips. Daily volume skews toward initial purchases that have to be held overnight — this makes A-share volume signals more directional than US volume signals, but also more prone to one-day herding extremes.
- Limit-up / limit-down days truncate volume. When a stock locks at limit-up, the bid order book may be enormous but executed volume can be small. Standard volume tools understate real demand on limit days. The PickSkill A-share dashboards flag limit days as outliers in the RVOL calculation.
- Margin-call cascades. A-share retail participation includes significant margin financing. Forced-liquidation cascades produce explosive volume spikes that look like climaxes but are mechanical rather than discretionary — the volume comes from forced sellers, not conviction. Pair volume signals with the margin-balance data (公开发布) where available.
See Best Indicators for A-shares for the broader market-specific playbook.
Track volume across your holdings. The /indicators dashboard surfaces RVOL, VROC, and the 5-day participation bucket on every chart — so you can see at a glance which moves have real conviction behind them.
How volume fits in a multi-signal workflow
Volume is the participation modifier — it raises or lowers the conviction on signals from every other layer:
| Signal type | Add volume to ask |
|---|---|
| Breakout from resistance | Is the break on heavy volume? (>1.5× RVOL) |
| MACD golden cross | Is the cross supported by participation increase? |
| Trend continuation | Is each push to a new high on higher volume than the last? |
| Top reversal | Is there volume climax + reversal bar combination? |
The simplest universal rule: if a signal happens on below-average volume, treat it as half-conviction. That single discipline filters out a substantial share of false-positive setups in any technical workflow.
Further reading
- Investopedia on volume analysis — comprehensive reference covering RVOL, VROC, and the standard patterns.
- Anna Coulling, A Complete Guide to Volume Price Analysis — practitioner's treatment of volume-confirmed price action.
FAQ
What counts as "heavy" volume? Heavy is relative — measured against the stock's own 20-day average. A useful rule of thumb: RVOL between 1.5 and 2.5 is meaningfully heavy; above 2.5 is exceptional and almost always tied to a specific catalyst (earnings, news, technical breakout). The PickSkill dashboards render RVOL with these thresholds highlighted so heavy bars are visible at a glance.
Should I use volume on intraday charts? Yes, with caveats. Intraday volume has strong intraday seasonality (heavy at open and close, light at midday); compare intraday volume to the same-time-of-day average over the last 20 sessions, not just to the prior bar. Otherwise you will mistake every late-afternoon spike for a real signal.
Why is volume different on different platforms? Three causes: (1) some platforms include extended-hours volume; PickSkill uses regular-session only for consistency, (2) some platforms count odd lots; most still do not, and (3) for US stocks listed on multiple exchanges, the headline volume sometimes covers only one venue. For consistency, the PickSkill dashboards use consolidated tape volume across all venues for US names and exchange-reported volume for HK and A-share names.
Can I use volume to predict a breakout direction? No — volume confirms direction once it has been chosen; it does not predict which direction the breakout will go. Dry-up volume during a consolidation tells you a directional move is more likely; it does not tell you up or down. For directional anticipation use accumulation patterns (capital flow trending up while price chops), not raw volume.
What is volume-weighted average price (VWAP) and is it the same as volume? VWAP is a derived price calculated by weighting each bar's price by its volume. It is a reference price — used heavily by institutional execution desks — but it is not a volume indicator. VWAP tells you the volume-weighted average price; raw volume tells you participation level. Different questions; use both, do not conflate them.