How to Export a Portfolio Report to Excel in 60 Seconds
Generate a multi-sheet Excel workbook from your PickSkill portfolio — holdings, indicators, valuation, signal trails. Real formulas, sortable tables, ready to share.
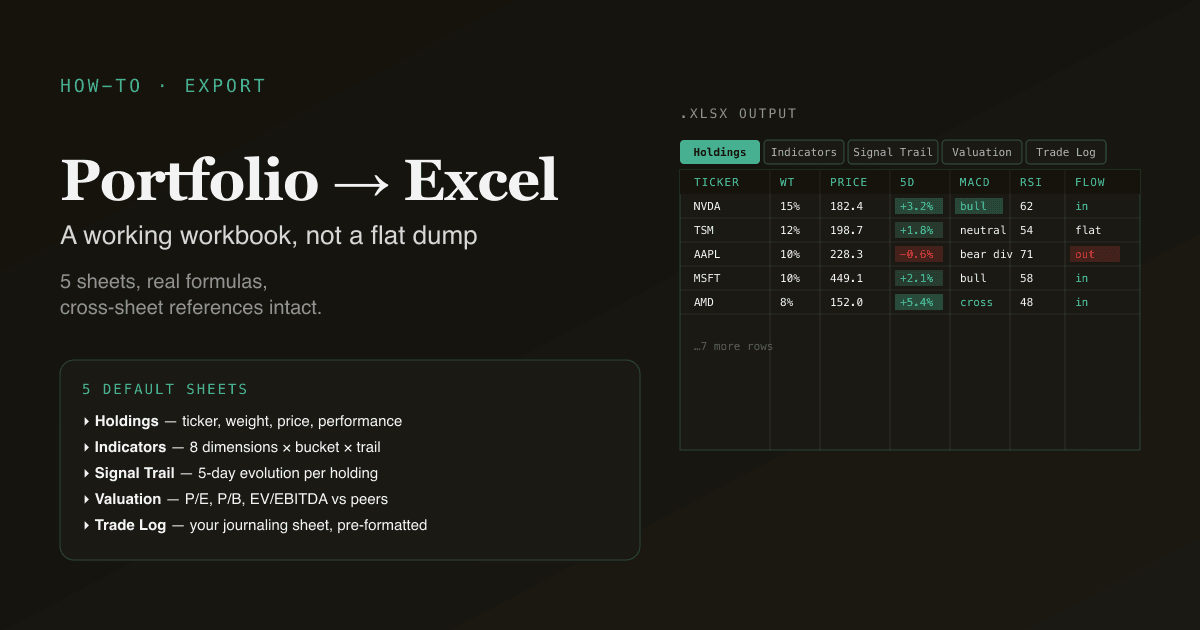
A real Excel workbook with portfolio analysis used to mean an hour pulling tickers and prices, an hour cross-referencing indicators, and a third hour formatting the output so anyone else can use it. This tutorial shows the same workflow in 60 seconds — every cell sourced from live data, every formula real, every sheet structured the way analysts actually share workbooks. The downloaded .xlsx is a working file: open it, sort any column, build pivots, share with a colleague. Nothing is a screenshot; nothing is a flat dump.
This is a 4-step tutorial. Each step is one prompt or one click. If you have a portfolio set up in PickSkill, you can run the entire flow in under a minute.
Key takeaways
- 4 steps, ~60 seconds. Open the portfolio, click export, pick Excel, refresh in your spreadsheet of choice.
- Every value is sourced from live data — prices from market feeds, indicators computed on the latest close, financials from the most recent filings.
- The workbook is multi-sheet and structured for filtering — Holdings, Indicators, Signal Trail, Valuation, Trade Log placeholder.
- Compatible with Excel, Google Sheets, LibreOffice Calc, Numbers. OpenXML format throughout — no platform lock-in.
- Works on US, HK, and A-share holdings with appropriate market conventions per sheet.
Why this matters
Excel remains the universal interchange format for portfolio analysis. PDFs are read-only; presentation decks are presentation-shaped; a chat thread doesn't sort. The Excel workbook is the only format you can actually work on collaboratively — building pivots, adding columns, cross-referencing with your own data.
PickSkill compresses the workbook-assembly step into a single click so your time goes back to the analysis. Three immediate use cases:
- Your personal portfolio dashboard. Save the workbook, re-export weekly, and you have a rolling trail of how indicators have evolved.
- Sharing with collaborators. Friends, an investment club, a partner — anyone with Excel can open and contribute to the same file.
- Building your own custom analysis on top. The exported workbook is your starting point; layer your own columns, scenarios, and notes without rebuilding the base.
The 4-step workflow
Step 1 — Open the portfolio you want to export
Go to /portfolios. Pick the portfolio you want to turn into a workbook. (For first-time setup, see Track a Portfolio with Indicators.)
The workbook scales well across portfolio sizes — from a 3-name watchlist to a 50-name diversified book. Larger portfolios produce a thicker Indicators sheet but the structure stays consistent.
Step 2 — Click "Export to Excel"
The portfolio detail page has an "Export to chat" cluster of buttons in the header. Click the Excel button. PickSkill opens a chat with a pre-filled prompt that includes the portfolio context.
The default prompt produces a 5-sheet workbook. To customise before sending:
- Add specific indicators or omit others: "Include only MACD, RSI, and the MA stack — skip Bollinger and KDJ." Useful when the audience is unfamiliar with certain indicators.
- Add fundamentals: "Include the last 4 quarters of revenue and EPS per holding." The fundamentals sheet appears in the workbook.
- Add scenarios: "Add a scenarios sheet with bull / base / bear price targets per holding." A blank scenarios sheet is added for you to fill in.
Step 3 — Wait ~30 seconds while PickSkill assembles the workbook
PickSkill does, in order:
- Pulls current price, intraday metrics, and historical price series (default 6 months) for every holding.
- Runs the full indicator suite (MACD, RSI, KDJ, Bollinger Bands, ADX, MA stack, volume, capital flow).
- Detects current signal state and the 5-day bucket trail per dimension.
- Pulls valuation multiples and ratios (P/E, P/B, EV/EBITDA, dividend yield).
- Renders all values into a structured multi-sheet workbook.
- Adds Excel formulas to cross-reference between sheets so changes propagate.
- Writes the result into a
.xlsxfile with embedded sparklines and conditional formatting.
You will see a streaming summary of the work. When complete, you get a download link valid for 7 days.
Step 4 — Open in Excel and customise
The downloaded .xlsx is a real working file. Open it in any spreadsheet tool. Common immediate edits:
- Sort by signal strength — click the column header on the bucket score field.
- Add a notes column — every sheet has a notes column on the right for personal annotations.
- Build a pivot table — pivot holdings by sector or signal bucket for a different cut of the data.
- Add your own columns — the workbook is designed for extension; nothing breaks when you add fields.
For larger edits, go back to the chat and request a specific update:
Add a sheet showing the 1-month, 3-month, and 6-month performance of each holding
against the SPY benchmark.
Re-do the indicators sheet with a heatmap colour scheme — green for bullish bucket,
red for bearish, amber for neutral.
Add a screen sheet that flags every holding with active divergence in MACD AND RSI
AND KDJ simultaneously.
PickSkill re-runs the workbook assembly with the new structure and gives you a fresh download.
Try it now. Go to /portfolios, click into any portfolio, and click "Export to Excel." The whole loop is under a minute.
What the output looks like
The default 5-sheet structure:
| Sheet | Contents |
|---|---|
| 1. Holdings | One row per holding — ticker, name, market, weight, current price, day change, 5-day change, 1-month change, position value, notes. Sortable. |
| 2. Indicators | One row per (holding × indicator) — current value, bucket label, 5-day bucket trail, signal annotation. Cross-references to the Holdings sheet. |
| 3. Signal Trail | One row per holding — the full 5-day evolution across all 8 indicator dimensions, with the bucket transitions highlighted. |
| 4. Valuation | One row per holding — P/E, forward P/E, P/B, EV/EBITDA, dividend yield, sector medians for comparison. |
| 5. Trade Log | Pre-formatted blank sheet — columns for date, ticker, action, quantity, price, rationale. For your own trade journaling, prepopulated with the holdings list. |
The sheets are linked: changing a ticker in the Holdings sheet (e.g. renaming a column header) does not break the cross-references in the other sheets. Adding rows to the Trade Log does not invalidate the rest of the workbook.
Common follow-up prompts
Once you have the base workbook, these prompts add the most value:
- "Add a Risk sheet — concentration metrics, sector exposures, correlation matrix across holdings."
- "Add a Watchlist sheet with 10 tickers I might add to this portfolio, ranked by their current technical setup."
- "Add a Macro sheet — VIX, 10-year yield, dollar index, oil — so I can correlate portfolio behaviour with macro drivers."
- "Convert the indicators bucket labels to numeric scores (−2 to +2) so I can compute portfolio-level signal averages."
- "Make the same workbook for a different portfolio and merge the two so I can compare side-by-side."
Each prompt triggers a fresh workbook generation.
What you can't do in 60 seconds
Honest caveats:
- Custom formula architectures. If you need a specific Excel formula structure (named ranges with specific conventions, cross-workbook references, custom VBA), you'll add those manually on top of the export.
- Real-time updates. The workbook is a snapshot at export time. PickSkill does not push live updates into an already-open Excel file. To refresh, re-export from the chat — takes 30 seconds.
- Heavy macro / VBA scripting. The output is data and formulas. Macros, custom ribbons, and conditional VBA logic remain manual additions.
- Direct connection to your brokerage account. PickSkill does not pull live position data from third-party brokerages; the holdings list comes from your manually maintained portfolio in /portfolios.
How this works under the hood
For the technically curious:
- PickSkill assembles the workbook structure first (a list of sheets, columns, data values, and formulas).
- Each sheet's data is generated using the same backend logic that powers the /indicators dashboards.
- The
.xlsxfile is written using the OpenXML format — every cell, formula, conditional format, and sparkline is a real Excel object. - Cross-sheet references use standard A1 notation so they work in any compatible spreadsheet tool.
The output behaves like a hand-built workbook for editing and sharing purposes but is generated in seconds.
FAQ
Do I need Excel installed to use the output?
No — the .xlsx file opens in Excel, Google Sheets, LibreOffice Calc, Apple Numbers, or any OpenXML-compatible tool. All standard formulas (SUM, AVERAGE, IF, INDEX, MATCH) work across these tools; PickSkill avoids Excel-specific functions in the default export.
Do the formulas live-update when I open the workbook? The formulas update against the workbook's own cells (changes to one cell propagate to dependent cells). They do not live-fetch new market data — that would require an active data connection. To refresh the underlying data, re-export from the chat.
Can I share the workbook with someone who doesn't have a PickSkill account? Yes — the workbook is a standalone file. Once downloaded, share it however you normally share Excel files (email, cloud drive, Slack). The recipient does not need a PickSkill account to open or use it.
Does this work for portfolios with A-share or HK holdings?
Yes. The workbook recognises HKEx tickers (9988.HK, 0700.HK) and A-share tickers (600519.SS, 000333.SZ) and applies market-appropriate conventions. Limit-day bars (A-shares) are flagged in the Signal Trail sheet so technical signals from those bars are treated as outliers.
How do I get this workbook to update automatically every week? Two options. The simple way: bookmark the chat session and re-run the export prompt weekly — PickSkill rebuilds the file with the latest data. The more automated way (in design): scheduled workflows that re-run the export on a schedule and email you the updated file — see the workflows design doc for the upcoming feature.
Can I add my own custom indicators to the workbook? The Indicators sheet is structured so you can add columns for your own metrics on the right side. The cross-sheet references will not break. For PickSkill to compute the metric for you, ask in the chat — most common variations (different indicator periods, different bucket thresholds, custom signals) can be added by request.