Track a Multi-Stock Portfolio with Technical Indicators
A 5-step tutorial: set up a portfolio, layer 8 indicator dimensions, and use AI dashboards (MACD, KDJ, divergence, flow) to spot signals.
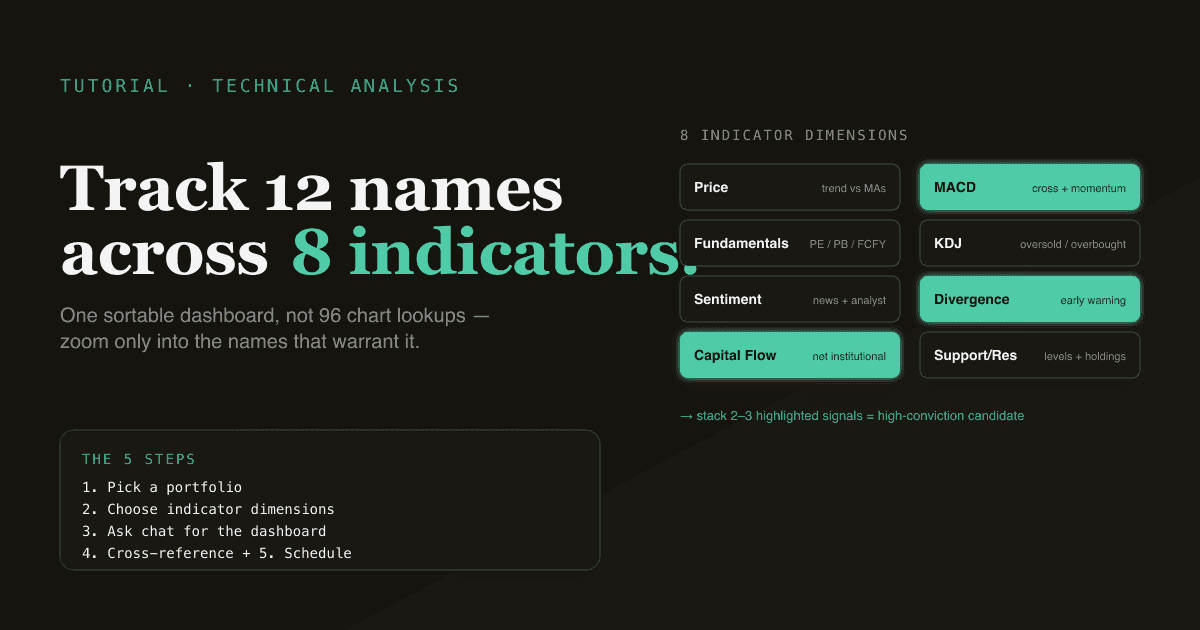
Retail investors usually hit the same wall: they hold 8–15 positions, want to know which ones are at a technical inflection (MACD cross, KDJ oversold, RSI divergence, abnormal capital flow), but reading the chart of every position every day is unsustainable. This tutorial shows how to set up a portfolio in PickSkill, layer eight indicator dimensions across it, and get an at-a-glance signal dashboard so you only zoom into the names that actually warrant attention.
Key takeaways
- Eight indicator dimensions ship out of the box: price, fundamentals, sentiment, capital flow, divergence, KDJ, MACD, support/resistance.
- One dashboard, every position. Each indicator dimension renders as a sortable HTML report covering all holdings — you see which 2 out of 12 names are at MACD golden cross today, not which one of them you haven't checked yet.
- Refresh on demand or schedule recurring updates. Default reports are HTML files cached against the latest market close.
- Works on US, HK, and A-share tickers. PickSkill pulls the right price + indicator series per market.
- Uses the existing
/portfoliossurface for holdings storage and/indicatorsfor dashboards — chat is the way you ask for new views.
Why this matters
Tracking a 12-name portfolio across 8 indicator dimensions by hand is 96 chart-lookups per day. Even at 30 seconds per chart, that's nearly an hour — every trading day. Most retail investors compress that into "look at the few positions I'm anxious about" which means the signals from positions they're NOT anxious about quietly slip past. The indicator dashboards turn 96 lookups into one scan: you see all 12 names × 8 dimensions on one page, sortable, with the inflection moments highlighted.
The 5-step workflow
Step 1 — Create or pick a portfolio
Go to /portfolios and either create a new portfolio or use an existing one. A portfolio is just a named bucket of holdings (ticker + shares + optional cost basis). You can have multiple portfolios — one for US large caps, one for A-shares, one for an experimental basket.
If you've already added holdings via natural language ("add 100 NVDA at $135 to my main portfolio"), they're already there.
Step 2 — Pick the indicator dimensions you care about
PickSkill ships with eight dimensions, each tuned for a different question:
| Dimension | Question it answers |
|---|---|
| Price | Where is each name vs. 5/20/60-day moving averages? Trending up, down, or sideways? |
| Fundamentals | PE / PB / Dividend Yield / Free Cash Flow Yield by holding |
| Sentiment | News + analyst-action sentiment for each name |
| Capital Flow | Net institutional flow over the last 5–20 trading days |
| Divergence | Price-vs-volume or price-vs-RSI divergence — early warning |
| KDJ | Stochastic oversold (J<0) or overbought (J>100) signals |
| MACD | Golden cross / death cross + histogram momentum |
| Support/Resistance | Underwater positions (below cost), names testing resistance |
For most retail workflows the highest-leverage four are: Price, MACD, Capital Flow, Divergence.
Step 3 — Open a chat and ask for a dashboard
For my "Tech Largecaps" portfolio:
- Run the MACD dashboard
- Highlight any positions at golden cross or death cross today
- Sort by histogram strength
PickSkill pulls the position list from the portfolio, runs MACD calculations against the most recent daily bars for each name, generates the dashboard as a downloadable HTML file, and shows you the inflection names inline.
Step 4 — Cross-reference with the other dimensions
The single-dimension view is useful, but signals get stronger when they converge. After the MACD dashboard:
Of the names you flagged at MACD golden cross, which also show:
- Positive capital flow over the last 5 days?
- Bullish divergence (price down, RSI up)?
- Are above their 60-day moving average?
This is the actual research workflow — narrow 12 candidates to 2–3 by stacking signals.
Step 5 — Schedule the dashboard if it's useful
Once a dashboard view earns its keep, schedule it:
Run this MACD dashboard for "Tech Largecaps" every weekday after US close.
Email me only when ≥1 position crosses (no daily noise email).
The conditional-email pattern is the difference between a useful tool and one more inbox source. PickSkill respects that distinction.
Try it now. Create a portfolio, then open a chat and paste the Step 3 prompt with your portfolio name.
Indicator dimensions worth knowing in detail
For technical-analysis frameworks the dashboards rest on:
- MACD (Moving Average Convergence Divergence) — the cross of the 12-EMA over the 26-EMA, with a 9-period signal line. Golden cross = bullish momentum starting; death cross = bearish momentum starting. Histogram strength shows how committed the momentum is.
- KDJ — a variant of Stochastic with the J-line amplifying extremes. J<0 = oversold (mean-reversion candidate), J>100 = overbought (caution).
- Divergence — when price makes a new high but RSI doesn't (bearish divergence) or price makes a new low but RSI doesn't (bullish divergence). Often the earliest signal of a reversal.
- Capital Flow — net institutional/large-order flow, available for HK and A-share names via exchange-disclosed data and approximated for US names from block-trade data.
What you can't do this way
- Intraday signals. The dashboards default to daily-bar indicators. Intraday timing is a different workflow (and a different tool category).
- Options strategies. Indicators here are equity-only.
- Auto-execute trades. PickSkill surfaces signals; it doesn't place orders.
How this complements the foundation cluster
The foundation cluster (DCF, WACC, FCF, 10-K) is fundamental research — does this company deserve to be in my portfolio at all? This tutorial is technical monitoring — given the names I've decided to hold, when is each one at an inflection? Most retail workflows benefit from both layers: pick names on fundamentals, time them with technicals.
FAQ
Do I have to set up portfolios manually?
No — you can add holdings via natural language in /chat ("add 50 AMD to my tech portfolio") and PickSkill mirrors them to the /portfolios surface. Or upload a CSV directly.
How fresh is the data? Equity prices are end-of-day for US (the /indicators dashboards are cached against the most recent close); A-share and HK prices update intraday on the relevant market hours. Capital-flow data is end-of-day across all markets.
Can I run dashboards across multiple portfolios at once?
Yes — "run the MACD dashboard across all my portfolios and group by portfolio". PickSkill assembles a multi-portfolio view.
Does the dashboard work on A-shares?
Yes — KDJ and MACD are particularly popular in A-share retail circles, and the indicator engine handles A-share tickers (600519.SS, 000333.SZ) and the trading-day calendar correctly.
How do I get the scheduled email setup? Schedule from the chat ("run this MACD dashboard for 'Tech Largecaps' every weekday after US close; email if ≥1 cross"). The scheduling integrates with the same email address you signed up with.