How to Screen Stocks for a Golden Cross in 60 Seconds
Find every stock in your watchlist with a fresh 50/200 MA cross — and the higher-edge underwater variant. Workflow in 4 steps with PickSkill.
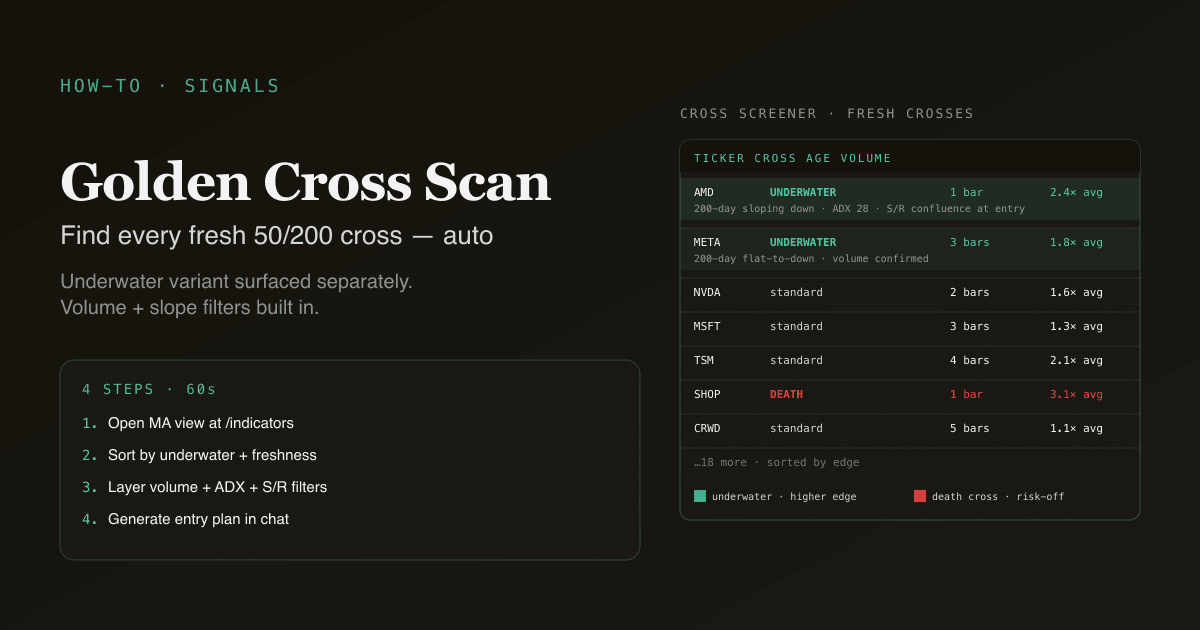
A golden cross is the 50-day moving average crossing above the 200-day moving average — one of the most-watched technical events in equities. Scanning a portfolio or watchlist for fresh crosses by hand means checking every name's chart, which scales badly. PickSkill's MA dashboard runs the scan automatically and surfaces both the standard golden cross and the higher-edge underwater variant, where the 200-day is still sloping down at the moment of cross. This tutorial walks through using the screener as part of a real workflow — not just spotting crosses, but acting on them with the right filters.
Key takeaways
- 4 steps, ~60 seconds. Open the MA dashboard, identify fresh crosses, filter by the underwater state, layer confirmation before acting.
- The underwater variant has historically produced stronger forward returns than the standard cross — it catches regime change rather than continuation.
- Multi-filter screening reduces noise: fresh cross + slope + volume confirmation + support / resistance context.
- Works across US, HK, and A-share names with appropriate market-specific cross handling (limit-day exclusion for A-shares).
- Pairs naturally with the /portfolios workflow — scan your existing watchlist or build one from the screener output.
Why this workflow matters
The bare 50/200 cross has thin standalone edge — historical hit rates sit near the unconditional market return. The reason traders still watch it is that the underwater variant — fresh cross with the 200-day still sloping down — has materially better forward returns. Without a tool that separates the two variants, retail investors treat every cross identically and miss the higher-edge subset.
The other reason hand-screening fails: the cross is a moment-in-time event. By the time you notice it via headline ("S&P 500 confirms golden cross"), it's been priced in for two weeks. Catching the cross within 1–3 bars of the event matters; doing that across a 20-name watchlist requires automation.
For the underlying concept, see What Is a Golden Cross (and Death Cross)?.
The 4-step workflow
Step 1 — Open the MA dashboard
Go to /indicators and select the moving-average dimension. The dashboard surfaces every holding's current 50/200 cross status, plus the slope of the long MA, and flags fresh crosses (within the last 5 bars).
The view is sortable by:
| Sort | Use |
|---|---|
| Cross freshness | Newest crosses at the top — most actionable |
| Underwater flag | Underwater crosses prioritised — higher-edge variant |
| Trend strength | Pairs with ADX reading |
| Volume confirmation | Crosses with volume above 1.5× the 20-day average — better follow-through |
The default sort prioritises fresh underwater crosses with volume confirmation — i.e., the highest-edge variant.
Step 2 — Identify fresh crosses
Three states the dashboard can show for each holding:
| State | What it means |
|---|---|
| Standard golden cross (uptrend already up) | 50 above 200; 200 sloping up. Trend continuation. |
| Underwater golden cross | 50 above 200; 200 still sloping down. Regime change candidate — the rarer and higher-edge variant. |
| Bearish (death) cross or pre-cross | 50 below 200, or 50 and 200 close to crossing in the bearish direction. Risk-off signal. |
Focus on the underwater state. Across major indices, underwater golden crosses occur 2–4 times per decade and tend to mark the end of significant drawdowns. On individual names, they appear more frequently but still represent the structurally higher-edge setup.
For the dashboard's purposes, "fresh" means the cross happened within the last 5 trading bars. Older crosses have been priced in.
Step 3 — Layer additional filters
A fresh cross alone is a starting point, not an entry trigger. Apply these filters in order:
- Volume confirmation. The cross day's volume should be at least 1.5× the 20-day average. Light-volume crosses fail at significantly higher rates than heavy-volume crosses. See Volume Analysis for the broader context.
- Capital flow alignment. Capital flow (MFI, CMF, OBV) should be trending up alongside the cross. Crosses on declining flow are more likely to be false signals.
- Support level proximity. A cross occurring near a significant support level is structurally stronger than one happening in open space — the level provides a natural risk-management anchor.
- No contradicting momentum signal. RSI should not be deep in overbought territory (>75) at the moment of cross — a cross into immediate overbought is often a continuation top, not a fresh entry opportunity.
Apply all four filters and the number of actionable crosses drops by 70–80%. The remaining candidates have materially better forward-return profiles.
Step 4 — Generate an entry plan
Once a candidate passes the filters, use PickSkill's chat to generate a structured entry plan:
For [ticker], generate an entry plan around the fresh golden cross:
- Suggested entry price (current vs pullback to 50-day MA)
- Stop level (below the most recent swing low or the 200-day MA, whichever is lower)
- Initial target (the next resistance level)
- Position sizing based on a 1% portfolio risk per trade
PickSkill returns a structured plan with sourced levels, target rationale, and a sizing formula. You can adjust assumptions in the chat and re-run.
Try it now. Open /indicators, select the MA view, and sort by underwater + freshness. Even on a small portfolio you'll likely see 1–2 fresh underwater candidates per quarter — the volume of high-quality opportunities is higher than most retail investors expect once the screening is automated.
What the dashboard catches that hand-screening misses
1. The underwater distinction
By-hand chart inspection treats every golden cross identically. The dashboard distinguishes the standard cross (trend continuation) from the underwater cross (regime change). The latter is rare and structurally higher-edge — automation surfaces it explicitly.
2. Multi-name simultaneous scanning
Hand-screening works for a few names; the dashboard scans a 20+ name portfolio in seconds. The breadth catches setups you wouldn't have thought to check — particularly on names you'd already given up on or hadn't visited in weeks.
3. Sub-5-bar freshness
The 50/200 cross is most actionable within 1–3 bars of the event. By-hand inspection often catches the cross 1–2 weeks late, by which point the easy part of the move has already happened. The dashboard surfaces fresh crosses the moment they print.
Four pitfalls in using the screener
- Acting on the cross alone, no filters. The bare cross is close to a coin flip. Without volume confirmation, trend-regime check, and level proximity, you are trading noise.
- Ignoring the underwater distinction. A standard golden cross in an existing uptrend is the high-volume, low-edge variant. The underwater cross is the rare, higher-edge variant. Don't conflate them.
- Chasing the cross day. The cleanest entry is often a pullback to the 50-day MA after the cross has confirmed, not buying the moment the cross prints. The first pullback to the cross level is the highest-edge entry point on a typical successful cross.
- No invalidation discipline. Define the stop level before entering — the most recent swing low or the 200-day MA, whichever is lower. If price reaches the stop, the trade is wrong; close it. The cross is a probabilistic signal, not a certainty.
How crosses behave differently on A-shares
A-share microstructure changes the screening criteria:
- Cultural emphasis on 20/60. A-share retail community watches the 20/60 cross more closely than the 50/200. The dashboard surfaces both; on A-share names, weight the 20/60 cross more heavily as a coordination signal.
- Limit-day exclusion. Limit-up and limit-down bars create stair-step patterns in both MAs. PickSkill flags these bars as outliers in the cross detection — without this filter, consecutive limit days would produce false fresh-cross signals.
- Halt handling. When a stock is halted for days then resumes, the MA stack effectively restarts. Crosses that occur within 10 bars of a halt resumption should be treated with caution.
See Best Indicators for A-shares for the broader playbook and MACD on A-Shares vs US Stocks for the cross-market comparison.
Common follow-up workflows
Once you have a candidate from the cross screener, these are natural next moves:
- "For each name with a fresh underwater golden cross, check whether MACD is also in a bullish state and surface only the names with both signals aligned."
- "Generate a watchlist of every stock in the S&P 500 currently within 2 bars of an underwater golden cross."
- "Backtest the 50/200 underwater cross on this specific ticker over the last 10 years — hit rate, average return, time to target."
- "Build a portfolio of the top 10 underwater-cross candidates equal-weighted, with an automated stop at the 200-day MA."
- "Compare this ticker's current cross to its previous golden cross 2 years ago — was that one underwater, and what happened next?"
Further reading
- What Is a Golden Cross (and Death Cross)? — the underlying concept and the underwater variant.
- What Is a Moving Average? — the foundation of the cross signal.
- Meb Faber, A Quantitative Approach to Tactical Asset Allocation — academic backing for simple MA cross rules.
FAQ
How often do underwater golden crosses occur? On major indices, 2–4 times per decade — usually at the end of significant drawdowns. On individual stocks, more frequently (a few per year on a 20-name watchlist). The rarity of the index-level signal is part of what makes the individual-name signal valuable: when an individual stock prints one in the absence of an index signal, the move is name-specific rather than market-wide.
Is the standard golden cross worthless? Not worthless, but lower-edge. The standard cross (in an existing uptrend) functions more as a "trend is intact" filter than an entry signal. Use it as a portfolio-level regime check ("more of my holdings are above the 200-day SMA than below") rather than as an individual-name trigger.
Why is the underwater variant better? Two reasons. (1) It catches regime change rather than continuation — historically the higher-edge setup. (2) It is rarer, which means it suffers less from over-trading. Discretionary investors who trade every standard cross run a high-turnover, low-edge strategy; investors who wait for underwater crosses run a lower-turnover, higher-edge strategy.
Can I trade options on a golden cross? You can, but timing matters. Implied volatility around the cross is often pricing in some level of trend recognition. The cleaner structure is to position before the cross using the underwater setup as the watchlist trigger, plus an oversold RSI reading and a price level break as the entry trigger. Buying calls at the cross often pays a premium for the headline.
What time-frame does the screener use? Daily bars by default — matching the standard convention for the 50/200 cross. Weekly cross screening (50-week vs 200-week MA) is available via chat prompt — useful for very long-term positioning but less actionable. Intraday cross screening is not surfaced because the signal degrades sharply on short timeframes.