What Is CPI — and How Does It Actually Affect Stocks?
CPI measures inflation. Formula, the headline vs core distinction, why "above/in-line/below consensus" moves markets, and the sectors that win and lose each scenario.
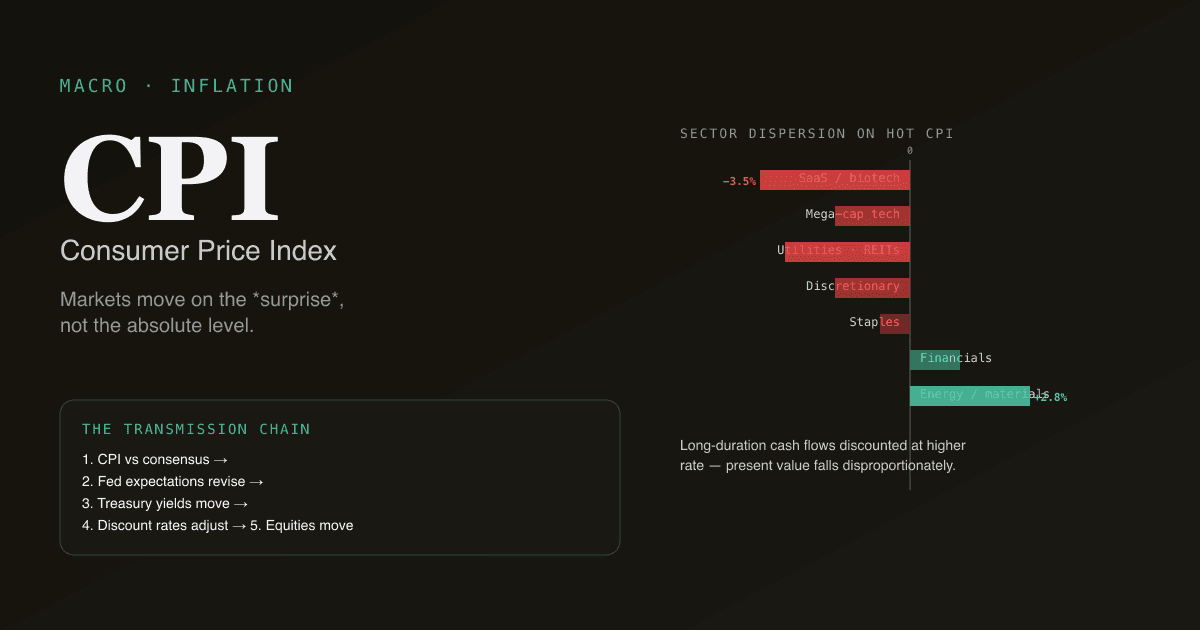
The Consumer Price Index (CPI) measures the average change over time in the prices paid by US consumers for a basket of goods and services. It is reported monthly by the Bureau of Labor Statistics, and the release is one of the four or five most market-moving data points of any given month. Markets move on the deviation from consensus, not the absolute level — a 3.2% reading is a buy or sell depending on whether economists expected 3.0% or 3.4%. The mechanics of why CPI moves stocks are concrete and learnable; the directional implications are sector-specific.
Key takeaways
- Two flavors that matter: headline CPI (all items) and core CPI (excluding volatile food and energy). Markets weight core more.
- The market reacts to surprise: above-consensus → typically risk-off (stocks down, dollar up, bonds down); below-consensus → typically risk-on.
- Fed implications are the real channel: hotter CPI = more rate hikes priced in = higher discount rates = lower equity valuations.
- Sector rotation is the second-order effect: utilities and growth tech are most sensitive to rates; energy and financials are partially hedged.
- Released second week of each month at 8:30am ET. Stocks gap on the print; the move usually largely plays out in the first 30 minutes.
How is CPI calculated?
The Bureau of Labor Statistics surveys a fixed basket of goods and services across major US urban areas, recomputing the price index each month. The methodology:
- Define the basket: representative consumption from the Consumer Expenditure Survey (food, housing, transportation, medical care, education, recreation, etc.)
- Price the basket monthly: BLS field representatives collect ~80,000 price observations across 75+ urban areas
- Index it to a base period: current value as a % of the 1982–1984 average
- Report the percent change: month-over-month (m/m) and year-over-year (y/y)
The two key reported values:
CPI y/y = (CPI[this month] / CPI[12 months ago] − 1) × 100%
CPI m/m = (CPI[this month] / CPI[last month] − 1) × 100%
The headline number markets quote is typically the year-over-year ("CPI rose 3.2%" means y/y). The month-over-month is closely watched for early signs of acceleration or deceleration; multiplied by 12 it gives the annualized monthly run-rate, which can diverge meaningfully from y/y around inflection points.
Headline vs Core — what's the difference?
The Bureau of Labor Statistics reports several CPI measures. The two that move markets:
| Measure | Includes | Why it matters |
|---|---|---|
| Headline CPI | All items including food and energy | What consumers actually pay |
| Core CPI | All items excluding food and energy | Cleaner read of underlying inflation pressure |
| Core services ex-shelter ("supercore") | Core minus the lagged housing component | Fed's preferred gauge in recent cycles |
Markets weight core more heavily for forecasting Fed behavior because:
- Food and energy prices are volatile and driven by global commodity moves outside Fed control.
- Core CPI is more persistent — once it embeds, it takes time to come back down.
- The Fed targets PCE inflation (a different but correlated index), and core PCE tracks core CPI much more closely than headline.
The Fed's stated 2% inflation target refers to the core PCE deflator, not CPI. But the CPI release leads the PCE release by ~2 weeks, so markets use the CPI as a high-frequency proxy.
Why CPI moves stocks
The transmission is mostly through rates:
- CPI release → 2. Market revises Fed expectations → 3. 2-year and 10-year Treasury yields move → 4. Equity discount rates adjust → 5. Stocks move
The whole chain plays out in the first 30 minutes after the 8:30am ET release. The biggest moves happen in the most rate-sensitive parts of the market.
A useful framework for the four scenarios:
| Scenario | Bonds | Dollar | Equities (broad) | Equities (sector dispersion) |
|---|---|---|---|---|
| Hot CPI (above consensus) | Yields rise, bonds sell off | Dollar up | Down | Energy, financials hold up; tech, utilities weak |
| In-line CPI | Modest move | Modest move | Modest move | Sector rotation contained |
| Cool CPI (below consensus) | Yields fall, bonds rally | Dollar down | Up | Tech, utilities rally; financials weak |
| Very cool CPI (large surprise low) | Yields plunge | Dollar weakens | Up sharply | Growth and tech outperform massively |
The "very cool" scenario is rare but historically produces the largest single-day equity moves of the year. A 30-bp surprise to the downside has produced 2%+ S&P 500 days repeatedly.
Sector dispersion — what wins and loses
Different sectors respond differently to inflation prints:
| Sector | Sensitivity to higher rates | Hot CPI reaction | Cool CPI reaction |
|---|---|---|---|
| Long-duration tech (SaaS, biotech) | Very high (cash flows are far-future) | Underperform | Outperform |
| Mega-cap tech (AAPL, MSFT, GOOG) | Moderate (mature cash flows) | Moderate underperform | Moderate outperform |
| Utilities and REITs | High (income proxies; rate competition) | Underperform | Outperform |
| Financials (banks) | Mixed — higher net interest margin, but credit risk | Mixed | Mixed |
| Energy and materials | Low — commodities are partially the inflation | Outperform | Underperform |
| Consumer staples | Moderate (some pricing power) | Modest | Modest |
| Consumer discretionary | High (consumer sensitivity to real income) | Underperform | Outperform |
The "long-duration" framing matters because high-multiple tech is essentially long-duration cash flows discounted at the equity discount rate. When the discount rate rises (hot CPI), the present value of distant cash flows falls disproportionately.
Four pitfalls in trading CPI
-
Trading the absolute level instead of the surprise. A 3.5% CPI is not automatically bearish; if consensus was 3.7%, it is bullish. The deviation drives the move, not the level.
-
Holding into the print with no edge. CPI prints produce sharp gaps; if you have no view (or no informational edge) on which side of consensus the print will land, holding through is gambling, not investing. The professionals trading these prints have proprietary inflation models or fast-data sources you don't.
-
Over-anchoring on one print. A single CPI print is noisy. The 3- to 6-month trend matters more than any single month. A hotter-than-expected print after a clear downtrend is much less bearish than a hotter-than-expected print confirming a re-acceleration.
-
Ignoring the supercore breakdown. The Fed pays disproportionate attention to "core services ex-shelter" (supercore) — it strips out lagged housing data that reflects 6–12 months of historical rents. The supercore can move differently from headline in any given month, and the Fed's reaction will follow supercore more than headline.
How CPI relates to other macro releases
The CPI sits in a calendar with several other major releases:
| Release | Timing | What it tells you |
|---|---|---|
| CPI | Second week of month, 8:30am ET | Inflation, ~2 weeks ahead of PCE |
| PCE deflator | Last business day, 8:30am ET | Fed's preferred inflation gauge |
| PPI | Day before CPI | Producer prices, partial leading indicator |
| NFP (jobs) | First Friday of month, 8:30am ET | Labor market tightness, drives wage inflation |
| FOMC meeting | 8 times/year, 2pm ET (statement) + 2:30pm ET (press conference) | Direct rate decision |
CPI is most market-moving in periods when the Fed is actively responding to inflation; less moving during periods of stable inflation. Around FOMC meetings, the CPI release before the meeting is the highest-leverage data point.
How CPI behaves differently across markets
| Market | Local inflation gauge | Notes |
|---|---|---|
| US | CPI (BLS) | Headline + core, supercore the Fed's focus |
| Eurozone | HICP (Eurostat) | Different basket weighting; ECB's policy target |
| China | CPI (NBS) | Heavily weighted toward food (pork especially); less sensitive to services |
| Japan | Core CPI excluding fresh food | BOJ's stated 2% target; persistent under-shoot historically |
For A-share investors, US CPI matters because it drives global discount rates and risk appetite. The China CPI matters more for domestic consumption sectors (consumer staples, food producers).
Track CPI impact on your portfolio. In /chat, ask "for my portfolio, simulate what a 30-bp hot CPI print would do based on the implied rate-sensitivity of each holding. Which positions are most exposed?" PickSkill pulls beta-to-rates data and renders the scenario.
Common follow-up prompts
- "Show me the next 6 CPI release dates and consensus expectations from the most recent forecaster surveys."
- "For my tech-heavy portfolio, what's the historical performance pattern around CPI surprises? Compare hot vs cool prints."
- "Find S&P 500 names with the lowest rate sensitivity that have outperformed during the last 5 hot CPI prints — the macro-hedge candidates."
- "Build a CPI watchlist combining inflation-sensitive sectors (energy, materials) and rate-sensitive sectors (tech, utilities)."
Further reading
- BLS CPI homepage — primary source; release calendar and methodology.
- Federal Reserve on inflation targeting — official treatment of why the Fed targets 2% and what gauge it uses.
- Investopedia on CPI — comprehensive reference.
FAQ
What's the difference between CPI and PCE inflation? Both measure inflation but with different baskets and methodology. PCE (Personal Consumption Expenditures deflator) is the Fed's preferred gauge — it uses broader weights, accounts for substitution (consumers switching to cheaper alternatives), and runs ~30 bps lower than CPI on average. CPI is released ~2 weeks before PCE for any given month, so markets use it as a leading proxy.
Why is supercore (core services ex-shelter) the focus? Core services ex-shelter excludes both the volatile food/energy and the lagged housing component. Housing CPI uses 6–12-month-old rent data, which significantly lags actual rent moves. Removing both yields the cleanest read on "wage-driven services inflation" — the kind the Fed believes it can most directly influence with rates.
How predictable are CPI prints? Reasonably predictable in aggregate, much less predictable in surprise. Consensus economist forecasts have historical 80%+ accuracy on the rounded headline number — but the ±10 bp surprise zone is where markets move most. Specialized inflation forecasters (Cleveland Fed's Inflation Nowcasting, BAML's high-frequency model) sometimes get the print first.
Should I trade around CPI releases? Most retail investors should not. The move plays out in 30 minutes around the 8:30am ET release; spreads widen sharply; volatility spikes. Professional desks with prop inflation models or fast-data infrastructure trade the print itself. Retail edge is in the follow-on — sector rotation in the days and weeks after the print, where the move is slower and the decision time is longer.
Does CPI affect international stocks the same way? The US CPI affects global risk appetite because dollar liquidity and US rates propagate worldwide. Hot US CPI → higher US rates → stronger dollar → tighter emerging-market conditions. For A-shares specifically, hot US CPI typically depresses A-share growth names through the global risk-off channel and slightly favors A-share energy/materials. Local China CPI matters more for domestic consumption sectors than for tech or financials.