What Is Market Cap? Why Size Matters More Than Most Retail Realizes
Market cap = price × shares outstanding. Small / mid / large / mega-cap definitions, why enterprise value matters more, and four pitfalls retail readers fall into.
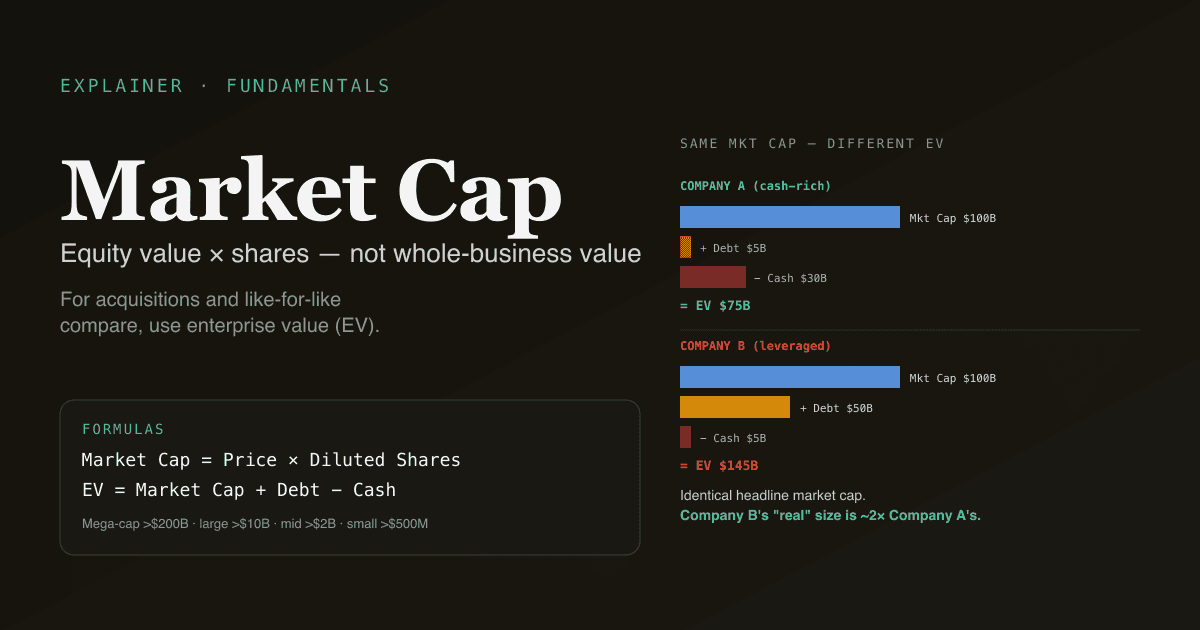
Market capitalization (market cap) is the total dollar value of a company's outstanding equity, calculated as the current share price multiplied by the total number of shares outstanding. It is the most basic measure of company size — and the most often misunderstood. A $1 trillion market-cap company is not buying for $1 trillion; it's buying for $1 trillion in equity plus its debt, minus its cash. The distinction matters enormously when comparing companies with very different balance sheets, and most retail valuation conversations skip it.
Key takeaways
- Formula:
Market Cap = Current Price per Share × Diluted Shares Outstanding. Use diluted, not basic — diluted accounts for options, RSUs, and convertibles. - The standard size buckets: Micro-cap (<$500M), Small-cap ($500M–$2B), Mid-cap ($2B–$10B), Large-cap ($10B–$200B), Mega-cap (>$200B).
- Enterprise value (EV) is the more honest "size" number:
EV = Market Cap + Total Debt − Cash. A debt-heavy company's "real" value is much larger than its market cap suggests. - Float ≠ market cap. Many large-cap names have heavily-concentrated ownership (founders, governments, family holdings); the tradeable float can be 30–60% of the headline market cap.
- Index inclusion is by market cap. S&P 500 inclusion adds buying pressure from index funds; "rebalancing day" trades around index events.
How is market cap calculated?
The basic formula is:
Market Cap = Current Share Price × Diluted Shares Outstanding
Three practical points:
-
Use diluted, not basic. Basic share count excludes options and RSUs that have not yet vested but will. Diluted includes them under the treasury stock method. For heavy-SBC tech companies the difference is 3–10%; for legacy industrials it is often <1%.
-
Share count changes over time. Buybacks reduce share count; new equity issuance increases it. A company's market cap can stay flat while the equity per share compounds higher through buybacks.
-
Two share classes complicate things. Companies like Alphabet (GOOG vs GOOGL), Meta (Mark Zuckerberg's Class B), and many Asian dual-listings have two classes of stock with different voting rights but identical economic claims. The headline market cap sums both classes.
The size buckets and why they matter
| Category | Range | Examples |
|---|---|---|
| Mega-cap | >$200B | AAPL, MSFT, NVDA, GOOG, AMZN, META, TSLA, BRK.B, TSM |
| Large-cap | $10B – $200B | Most S&P 500 names |
| Mid-cap | $2B – $10B | S&P 400 Mid-Cap Index |
| Small-cap | $500M – $2B | Russell 2000 components |
| Micro-cap | $50M – $500M | Below most index thresholds |
| Nano-cap | <$50M | Often illiquid, OTC-listed |
The size category drives:
- Index inclusion — S&P 500 has a market-cap threshold (currently ~$18B effective minimum). Inclusion adds passive buying pressure.
- Institutional eligibility — many funds have minimum market cap mandates (e.g., $1B+) for liquidity reasons.
- Coverage — sell-side analyst coverage drops sharply below $5B market cap. Below $1B, you may be the only one looking at the company.
- Trading characteristics — small-cap and micro-cap names trade with materially wider bid-ask spreads, higher volatility, and lower liquidity. Position sizing and stop discipline matter more.
- Return profile — academic literature (Fama-French) documents a persistent small-cap premium over very long horizons, though it has weakened in recent decades.
Why enterprise value matters more
Market cap measures the equity side only. Enterprise value (EV) measures the whole business:
Enterprise Value = Market Cap + Total Debt − Cash & Equivalents
EV is what an acquirer would pay to buy the entire business — they take on the debt and inherit the cash. Two examples to make the difference vivid:
| Company A | Company B |
|---|---|
| Market cap: $100B | Market cap: $100B |
| Debt: $5B | Debt: $50B |
| Cash: $30B | Cash: $5B |
| EV: $75B | EV: $145B |
The two companies have identical market caps but Company B's actual size is nearly 2× Company A's. Comparing them on P/E (which uses market cap implicitly) misses this; comparing them on EV/EBITDA captures it.
This is why sophisticated valuation uses EV/EBITDA for companies with materially different capital structures — it normalizes for debt and cash differences.
The float distinction
Total shares outstanding ≠ float. Float is the tradeable portion of the shares — what's actually in the market.
Excluded from float:
- Founder / insider holdings (often locked up or only sold via Rule 10b5-1 plans)
- Government holdings (especially A-share state-owned enterprises and HK government holdings)
- Strategic stakes by other companies
- Restricted shares held by employees pre-vesting
For a typical large-cap, float is 80–95% of total shares. For founder-controlled companies (Meta, Tesla, Alphabet, BABA, many A-share tech IPOs), float can be 60–75%. For state-owned A-share names (PetroChina, ICBC), float can be as low as 20–30%.
Why this matters:
- Liquidity is float-based. A "large-cap" with a small float can have small-cap-style spread and volatility.
- Index weight is float-adjusted. S&P 500 weights are based on float, not total market cap — so heavily insider-held names have lower index weights than their headline market cap suggests.
- Buyback pressure scales with float. A $5B buyback on a $50B float is meaningfully larger than a $5B buyback on a $200B float.
Four pitfalls retail readers fall into
-
Treating market cap as "value." Market cap is what the equity is worth at today's price. Whether that price is "right" requires a separate valuation analysis. A $500B market cap doesn't mean the business is worth $500B — it means the market says $500B today.
-
Ignoring debt when comparing companies. Two companies with identical market caps but very different debt loads are not comparable on a market-cap basis. Use EV for like-for-like comparison across capital structures.
-
Forgetting that share count changes. Mature companies returning capital via buybacks have shrinking share counts (and rising EPS even with flat earnings). Growth companies issuing equity have rising share counts. The same market cap with rising vs falling share count tells very different stories about per-share value compounding.
-
Misreading "market cap below cash." When market cap drops below the cash on the balance sheet (rare, usually during distress), the implication is "the market values the operating business at zero or less." Sometimes this is the bottom of a deep-value opportunity; more often the market is right and the cash will be burned or the business has off-balance-sheet liabilities. Investigate carefully before assuming the market is wrong.
How market cap relates to other valuation metrics
| Metric | Formula | What it tells you |
|---|---|---|
| Market Cap | Price × Shares | Equity value at current price |
| Enterprise Value | Mkt Cap + Debt − Cash | Whole-business value |
| Book Value | Total Equity from balance sheet | Accounting equity value |
| P/B | Market Cap / Book Value | Market view vs accounting view |
| P/E | Market Cap / Net Income | Market value vs earnings power |
| EV/EBITDA | EV / EBITDA | Whole-business value vs operating earnings |
| FCF Yield | FCF / Market Cap | Inverse of P/FCF — cash return on equity |
For absolute valuation see What Is DCF?; for relative valuation see DCF vs Comparable Company Analysis.
Run market-cap analysis on your portfolio. In /chat, ask "for each holding, show market cap, enterprise value, and the spread between them as a % of market cap — flag any where EV is more than 50% higher than market cap (heavily leveraged) or where EV is meaningfully lower than market cap (cash-rich)." PickSkill pulls the data and renders the table.
How market cap is reported across markets
| Market | Share-count convention | Notes |
|---|---|---|
| US | Diluted shares from 10-Q / 10-K | Buyback-adjusted; quarterly updates |
| HK | Issued shares from interim/annual report | Less frequent updates; dilution from share option schemes |
| A-shares | Total + free-float share counts (流通股 vs 总股本) | Distinct headline market cap vs free-float market cap; state-owned ownership lock-up tracked separately |
For A-shares specifically, the "总市值" (total market cap) and "流通市值" (free-float market cap) are reported separately because state ownership locks meaningful share blocks. Index weighting in A-share indices typically uses free-float market cap, similar to US convention.
Common follow-up prompts
- "For my US tech holdings, compare market cap to enterprise value. Which are leveraged and which are cash-rich?"
- "Show me S&P 500 names with market cap above $10B AND less than 20 analysts covering them — under-followed large-caps."
- "For [ticker], show 10-year history of market cap and share count. How much value creation came from price vs share-count change?"
- "Find A-share names with total market cap above ¥100B but free-float below ¥30B — heavily SOE-controlled large names."
Further reading
- Investopedia on market cap — comprehensive reference.
- Aswath Damodaran's market-cap-to-EV bridge analyses — academic treatment of when market cap and EV diverge meaningfully.
FAQ
What's the difference between market cap and enterprise value? Market cap measures the equity side of a company's value — share price times shares outstanding. Enterprise value measures the whole business — equity plus debt minus cash. EV is what an acquirer would pay to buy the company outright (taking on the debt, getting the cash). For two companies with similar market caps but different debt levels, EV is the apples-to-apples comparison. Use EV/EBITDA, not P/E, when comparing across capital structures.
Why is market cap-based size weighting controversial? The S&P 500 and most major indices weight by market cap, which means the largest companies (currently Apple, Microsoft, Nvidia) drive a disproportionate share of index returns. As of 2026, the top 10 S&P 500 names by market cap account for roughly 35% of the index. This concentration has been the subject of debate — some argue it reflects efficient market pricing; others argue it creates fragility if those names underperform. Equal-weighted variants (RSP, the S&P 500 Equal Weight ETF) offer an alternative.
How does buyback activity affect market cap? Buybacks reduce share count without changing the underlying business. If management buys back 5% of shares while net income stays flat, EPS rises 5% (because the same income is divided over fewer shares). The market cap can stay flat or even fall, but the per-share value rises. For long-term holders, share-count reduction is the more important metric than the absolute market cap.
Is "mega-cap" the right category for everything above $200B? The convention varies. Some sources use $200B+ as mega-cap; others reserve mega-cap for $500B+. In practice, the very top tier ($1T+) is often called "Magnificent Seven" or "trillion-dollar club" — currently AAPL, MSFT, NVDA, GOOG, AMZN, META, plus TSLA hovering near the threshold. These names disproportionately drive index returns and are the focus of most market-narrative commentary.
What's the relationship between market cap and stock price?
Market cap is the total equity value; stock price is the per-share value. The two are linked by share count: Market Cap = Price × Shares. A $1 trillion market cap with 5B shares means a $200 price; a $1 trillion market cap with 50B shares means a $20 price. The headline price has no real informational content on its own — what matters is the market cap, the share count dynamics, and the per-share value created over time.