How to Find Bullish Divergences Across a Portfolio in 30 Seconds
PickSkill's divergence dashboard scans every holding for the 4 divergence types across MACD, RSI, and KDJ — surfacing only well-defined pivots. Workflow in 4 steps.
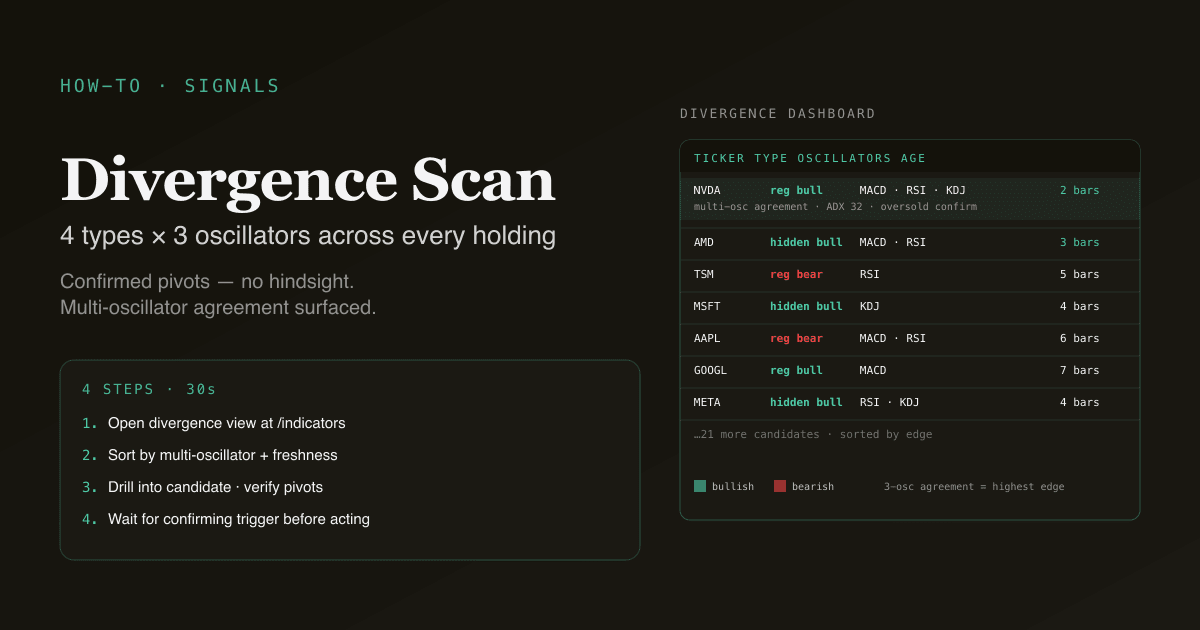
Finding divergence by hand is slow — you draw pivots in price, draw matching pivots in MACD or RSI, check whether the two disagree, and repeat for every name in your portfolio. Most retail investors give up after 3–5 names. PickSkill's divergence dashboard runs that scan across every holding in 30 seconds, applies confirmed-pivot rules (no hindsight bias), and surfaces only the names where the pattern is well-defined. This tutorial walks through using the dashboard productively — not just clicking through it, but turning the output into actual decisions.
Key takeaways
- 4 steps, ~30 seconds. Open the divergence dashboard, scan the active list, drill into candidates, layer additional filters before acting.
- The dashboard scans 4 divergence types across 3 oscillators — regular bullish / bearish and hidden bullish / bearish across MACD, RSI, and KDJ.
- Only confirmed pivots count. A pivot needs at least N bars on each side that fail to exceed it — no hindsight bias from drawing lines after the fact.
- Multi-oscillator divergence is the highest-edge variant. When the same divergence shows up in two of three oscillators, the signal is materially more reliable than divergence in any one alone.
- Hidden divergence is treated as a first-class signal — most retail platforms bury it; PickSkill surfaces it explicitly.
Why this workflow matters
Divergence is one of the most over-promised tools in technical analysis. Retail guides routinely claim 70%+ accuracy; backtests on bare divergence sit closer to 35–45%. The gap is filtering — divergence is a condition, not a signal, and it only becomes reliable when layered with trend filters and confirmation events.
The dashboard-based workflow makes the filtering practical. Without a tool that surfaces all divergences across all holdings simultaneously, you cannot apply the multi-oscillator filter (which requires checking three oscillators on every name). With the tool, the filter takes one click. The economics of layered filtering flip in your favour.
For the underlying concept, see What Is Divergence?.
The 4-step workflow
Step 1 — Open the divergence dashboard
Go to /indicators and select the divergence dimension. The dashboard scans every holding in your default portfolio across the four divergence types in MACD, RSI, and KDJ.
The output is a sortable table:
| Column | Meaning |
|---|---|
| Ticker | The holding |
| Type | Regular bullish / regular bearish / hidden bullish / hidden bearish |
| Oscillator(s) | Which indicator(s) show the divergence — MACD, RSI, KDJ, or some combination |
| Pivot age | How many bars ago the second pivot formed (newer = fresher signal) |
| Strength | Magnitude of the disagreement (larger = stronger signal) |
| Trend regime | ADX reading at the time of divergence — divergence in trending markets is more reliable |
The default sort is by combined strength × freshness × multi-oscillator agreement. The strongest signals appear at the top.
Step 2 — Scan for the high-conviction patterns
Three specific patterns to look for, in order of edge:
- Multi-oscillator regular bullish in oversold names. Regular bullish divergence in two of three oscillators (e.g. MACD + RSI), on a name where RSI is below 35 or KDJ is below 25, in a market regime with ADX above 25. This combination has historically delivered the strongest forward returns of any divergence pattern.
- Hidden bullish in confirmed uptrends. Hidden bullish divergence on a name that is above its 200-day SMA with the 200-day still sloping up. The hidden bullish pattern catches trend resumption after a pullback — statistically more reliable than catching reversals.
- Multi-oscillator regular bearish in overbought names. The mirror of pattern 1, used for risk management (trimming long exposure) rather than for shorting. Detecting a bearish divergence early in your own holdings is one of the highest-leverage uses of the dashboard.
Skip:
- Single-oscillator divergence on names with ADX below 20. Range-bound markets generate continuous low-quality divergences. The dashboard surfaces them; ignore them.
- Divergence with pivot age > 10 bars. Older pivots have been priced in. Divergence signals decay quickly — fresh signals (pivot age 1–5 bars) are where the alpha sits.
Step 3 — Drill into the candidate
Click a name in the dashboard to open the per-holding indicator detail. You should verify:
- The pivots are real. Look at the chart and confirm the two pivots in price and the two corresponding pivots in the oscillator. PickSkill's pivot detection is automated, but the eyeball check catches edge cases (gap days, limit-up bars in A-shares, earnings-day spikes).
- The trend regime is right. ADX above 25, MA stack aligned, support / resistance level nearby. Divergence at a major support level is materially stronger than divergence in the middle of a range.
- Volume confirms. Capital flow trending up while price grinds sideways is the right backdrop for bullish divergence; flow trending down on price highs is the right backdrop for bearish divergence.
These checks take ~30 seconds per candidate. After them, the false-positive rate drops substantially.
Step 4 — Layer one more filter before acting
A divergence is a watchlist trigger, not an entry trigger. Wait for one confirming event before sizing in:
- Bullish divergence: wait for the MACD line to cross above the signal line, or RSI to cross 50 from below, or the price to break above a recent swing high.
- Bearish divergence: wait for the MACD line to cross below the signal line, or RSI to cross 50 from above, or the price to break below a recent swing low.
The confirming event tells you when the move is starting. Without it, you are buying or selling into a condition that may persist for weeks.
Try it now. Open /indicators and select the divergence view. Even on a 5-holding portfolio you will likely see at least one active divergence per week — the volume of opportunity is higher than most retail investors realise once the scan is automated.
What the dashboard catches that hand-scanning misses
Three specific patterns benefit dramatically from automation:
1. Hidden divergence
Most retail charting platforms bury hidden divergence — the pivot inversion is harder to spot by eye, and most TA guides focus on regular divergence. PickSkill treats hidden divergence as a first-class signal, surfaced with the same prominence as regular divergence. Given that hidden divergence has the better empirical track record for trend-continuation, this is the variant you should be paying more attention to, not less.
2. Multi-oscillator agreement
By-hand scanning rarely catches divergence in two oscillators simultaneously — you'd have to check MACD, then RSI, then KDJ on every name, and the cognitive overhead means you stop at the first divergence you see. The dashboard surfaces multi-oscillator divergence as a distinct row, so the highest-edge variant is visible at a glance.
3. Cross-portfolio sweep
Hand-scanning works for 1–3 names. PickSkill's dashboard scans your entire portfolio (and if you ask, all of your watchlists) in the same view. The sweep catches signals on names you wouldn't have thought to check — the opportunities you find on names you'd already given up on.
Four pitfalls in using the divergence dashboard
- Treating divergence as a buy / sell button. It is a condition. Always wait for a confirming event (MACD cross, RSI exit from extreme, level break) before sizing.
- Acting on every divergence the dashboard surfaces. The dashboard intentionally surfaces all candidates including weak ones. Filter for trend regime (ADX > 25), multi-oscillator agreement, fresh pivots, and oversold / overbought confirmation before acting.
- Holding through invalidation. Divergence trades have specific invalidation levels — if price breaks the swing low that defined the bullish-divergence pivot, the trade is wrong. Honor the invalidation; don't average down.
- Forgetting position sizing. Even high-conviction divergences fail at meaningful rates. Size positions to survive the failure cases — never size as if the divergence is a certainty.
How divergence behaves on A-shares
The dashboard handles the A-share microstructure specifically:
- Limit-up / limit-down days are flagged as outliers and excluded from pivot detection. Without this filter, the limit price becomes an artificial pivot that produces false divergence.
- Halts create gaps in the data; pivots that span a halt are flagged as suspect and surfaced with a warning.
- Higher noise floor: A-shares trade with materially higher daily volatility. The dashboard uses a larger pivot-detection window (N=5 vs N=3 on US daily bars) for A-share names to filter out micro-swings.
For more on the market-by-market handling, see Best Indicators for A-shares.
Common follow-up workflows
Once you have a candidate from the divergence dashboard, these are the natural next moves:
- "Show me the same divergence detection on my full watchlist, not just the current portfolio."
- "Filter the active divergences to only those with ADX above 25 and the 200-day MA sloping up."
- "Backtest this divergence pattern — what is the historical hit rate on this specific ticker over the last 5 years?"
- "Generate an entry plan for the top divergence candidate — entry price, stop level, target, position size."
- "Make a watchlist of every holding that has been in active divergence for more than 5 days without resolution — these are the longest-coiling setups."
Further reading
- What Is Divergence? — the underlying concept and the four types.
- The 3-indicator filter — combining divergence with ADX and momentum confirmation.
- Constance Brown, Technical Analysis for the Trading Professional — practitioner's reference on divergence patterns.
FAQ
How often will the dashboard surface a divergence? On a 10-holding portfolio, you'll see 2–5 active divergences in a typical week. Multi-oscillator divergence (the higher-edge variant) is rarer — maybe one per week per 10 holdings. Hidden divergence appears more often in clearly trending markets and less often in choppy markets.
Should I take every divergence as a trade? No. The dashboard surfaces candidates; the filtering happens after. Layer trend regime, multi-oscillator agreement, fresh pivots, and confirming events before acting. The filtering reduces the number of trades by 60–80% but lifts the per-trade edge substantially.
What is the difference between regular and hidden divergence? Regular divergence is a reversal warning (price makes a new extreme; the indicator does not). Hidden divergence is a continuation signal (price makes a higher low in an uptrend; the indicator makes a lower low). The two patterns are mathematically symmetric but have opposite implications. Hidden divergence has the better empirical track record in trending markets.
Why does the dashboard sometimes show divergence on names that don't move? Divergence is a condition, not a guarantee of movement. Many divergences resolve via slow drift rather than sharp reversal. The dashboard surfaces the condition; whether the move materialises depends on the confirming event arriving. This is why the discipline of waiting for confirmation matters more than the discipline of spotting the divergence.
Can I get email alerts when a new divergence forms in my portfolio? The scheduled-workflows feature (in design, see the workflows design doc) will support this — daily or hourly scans that email you when new divergences appear. For now, the dashboard is on-demand: open it when you want the scan, and you get the current state.