How to Export a Portfolio Analysis to PowerPoint in 60 Seconds
Generate a presentation-ready PPTX from your PickSkill portfolio — every chart sourced, every slide editable. 4 steps, one prompt, designed for live presentation.
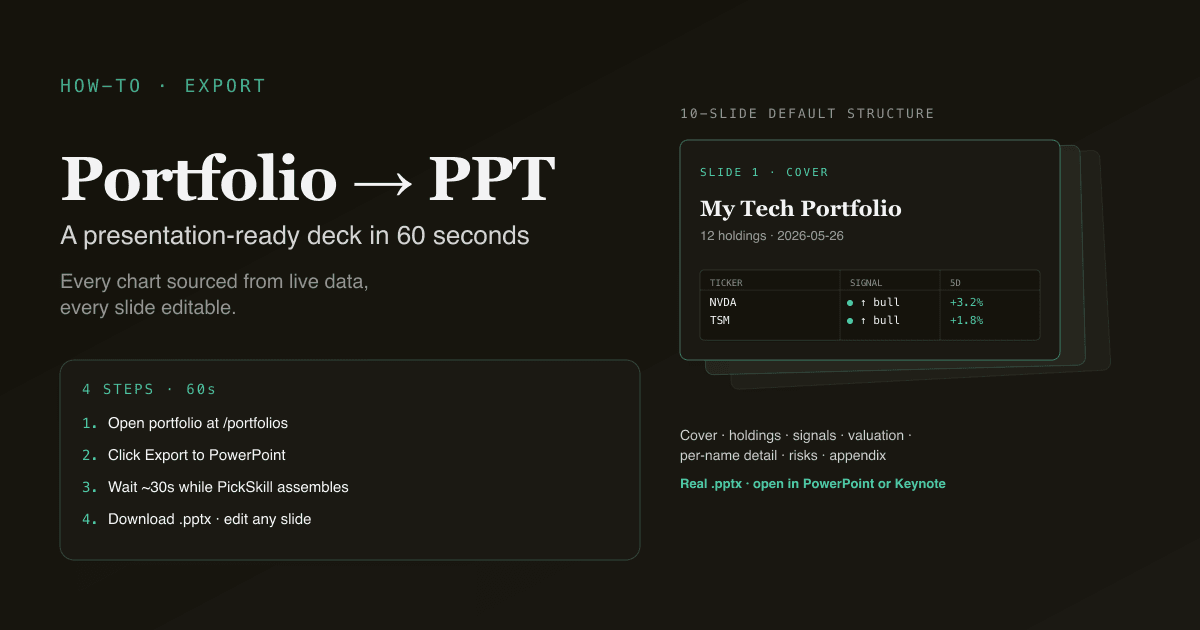
A real PowerPoint deck from a portfolio analysis used to mean an hour in Excel pulling charts, an hour in PowerPoint laying out slides, and a third hour fixing formatting once anyone reviewed it. This tutorial shows the same workflow in 60 seconds — every chart sourced from live data, every slide laid out with the design conventions used by professional research desks, and the .pptx file ready to download, edit, and present. The math behind the analysis is identical to what you would build by hand; what changes is the time you spend assembling versus the time you spend on the call.
This is a 4-step tutorial. Each step is one prompt or one click. If you have a portfolio set up in PickSkill already, you can run the whole flow in under a minute.
Key takeaways
- 4 steps, ~60 seconds. Open your portfolio, click export, pick PPT, edit slide titles.
- Every chart is sourced from live data. Indicators run on the latest close; financials pull from the most recent filing; valuation multiples reflect current consensus.
- The PPTX is a real PowerPoint file — not a screenshot, not a PDF. Open it, edit any slide, present from PowerPoint or Keynote.
- Works across US, HK, and A-share holdings. The deck adapts headings and analyst-speak to the markets your portfolio contains.
- The output includes a default 10-slide structure — cover, holdings summary, technical signals, valuation snapshot, indicator detail per name, risk callouts, and an appendix.
Why this matters
The reason most retail investors don't share their analysis is that the presentation layer is friction. By the time you have built the analysis you want to share, you have run out of patience for the deck assembly that makes it shareable. The result: a lot of private good work that never gets pressure-tested by other eyes.
PickSkill compresses the deck-assembly step into a single click so your time goes back to the analysis. Three audiences benefit:
- Your own future self. Saving a stake to a presentable artefact creates a record you can come back to in three months and read.
- Anyone you discuss positions with. Friends, an investment club, a partner who handles the family book. A deck makes the conversation more structured than a chat thread.
- A potential boss or interview committee. Aspiring analysts: a polished deck on a real-world portfolio is the most credible interview prop you can bring.
The 4-step workflow
Step 1 — Open the portfolio you want to export
Go to /portfolios. Pick the portfolio you want to turn into a deck — or create one fresh by adding 3–10 holdings. (For first-time setup, see Track a Portfolio with Indicators.)
The deck is designed for portfolios in the 3–15 holding range. Smaller than 3, the deck is thin; larger than 15, the per-holding section becomes too long for a typical 20-minute presentation.
Step 2 — Click "Export to PowerPoint"
The portfolio detail page has an "Export to chat" cluster of buttons in the header. Click the PowerPoint button. PickSkill opens a chat with a pre-filled prompt that includes your portfolio's current state — holdings, latest indicator readings, recent signal changes, and any divergence flags.
You can edit the prompt before sending. Two common edits:
- Change the locale: the deck title and chapter headings default to your account language. If the deck is for a specific audience (English presentation to a US team, Chinese presentation to mainland readers), adjust accordingly.
- Add custom emphasis: "Focus the technical section on divergence and overbought conditions" or "Lead with the FCF narrative" — PickSkill weights the deck composition toward your emphasis.
Step 3 — Wait ~30 seconds while PickSkill assembles the deck
PickSkill does, in order:
- Pulls current price, latest close, and 6-month price history for every holding.
- Runs the full indicator suite (MACD, RSI, KDJ, Bollinger Bands, ADX, MA stack, volume, capital flow) on each holding.
- Detects active signal patterns (golden cross, divergence, support / resistance proximity, bucket-trend changes over the 5-day window).
- Pulls valuation snapshots (P/E, EV/EBITDA, P/B) and the most recent financial summary.
- Renders the indicator charts as embedded images.
- Generates the deck content with the design conventions for editorial research presentation.
- Composes the
.pptxfile with embedded charts, formatted tables, and editable slide titles.
You will see a streaming summary of the work as it happens. When complete, you get a download link valid for 7 days.
Step 4 — Edit any slide, re-run for specific sections
The downloaded .pptx is a real PowerPoint file. Open it in PowerPoint, Keynote, or Google Slides. Every slide title, every chart caption, and every table is editable directly.
For deeper edits, return to the chat and request specific changes:
Re-do the technical signals slide. Highlight the three holdings with active
divergence and demote the rest to a single summary bullet.
Add a slide on capital flow trends. For each holding, show whether net flow
has been positive or negative over the last 5 sessions.
Compress the per-holding detail slides — one slide per holding instead of two,
showing only the technical bucket trail and the latest indicator chart.
PickSkill re-runs the deck assembly with the new emphasis and gives you a fresh download.
Try it now. Go to /portfolios, click into any portfolio, and click "Export to PowerPoint." The whole loop is under a minute.
What the output looks like
The default 10-slide structure:
| Slide | Content |
|---|---|
| 1. Cover | Portfolio name, date, holdings count, total value, headline performance |
| 2. Holdings summary | Table of all holdings — ticker, weight, current price, 1D / 5D / 1M return, market |
| 3. Technical signals overview | Heat-map style table showing each holding's bucket across all 8 indicator dimensions |
| 4. Active alerts | Holdings with material signal changes — fresh golden crosses, divergence flags, oversold readings |
| 5. Valuation snapshot | P/E, P/B, EV/EBITDA across holdings vs sector medians |
| 6–8. Per-holding detail | For each holding (or each top-weighted holding if portfolio is large): the price chart with key MAs, the dominant signal narrative, the 5-day bucket trail |
| 9. Risk callouts | Concentration risk, sector tilts, divergence warnings, and any holdings approaching key support / resistance |
| 10. Appendix | Data sources, indicator definitions, time stamps, disclaimer |
The slides use a consistent typographic system, brand-aligned colour palette, and embedded charts (not text descriptions of charts). The result is presentation-ready without per-slide formatting work.
Common follow-up prompts
Once you have the base deck, these prompts move the needle:
- "Add a one-slide bull case and one-slide bear case for the largest position."
- "Turn the technical signals overview into a stoplight format — green / amber / red dots only."
- "Add an appendix slide showing the full 5-day bucket history for each holding."
- "Make a version of this deck in Mandarin for a Chinese-speaking audience."
- "Generate the same content as a Word doc instead, for someone who prefers prose to slides." (See Generate an Investor Deck from a Chat for the format trade-offs.)
Each prompt triggers a fresh deck generation with the new structure.
What you can't do in 60 seconds
Honest caveats:
- Custom design templates. The deck uses PickSkill's own design template. You can edit slide content freely, but heavily branded corporate templates (custom fonts, logo placement, specific colour systems) require manual setup post-export. Most PowerPoint themes apply cleanly to the exported deck via Design → Variants.
- Forecast / projection slides. The deck shows current state and recent signals — it does not forecast where prices are going next. Forecasts require explicit prompts and additional context.
- Synergy modelling for M&A. If you are using the deck for a deal-pitch context, the per-holding slides cover the standalone case; deal-specific synergy modelling needs its own conversation.
How this works under the hood
For the technically curious:
- PickSkill compiles the slide structure first (a JSON skeleton with chart specs, text content, and layout hints).
- Each chart is rendered as a high-resolution PNG using the same indicator code that powers the /indicators dashboard.
- The PPTX file is assembled programmatically using the OpenXML format — every shape, table, and image is a real PowerPoint object, not a flat rasterisation.
- Slide titles and body text are bound to the model's analysis output, so editing in the chat re-runs the analysis and produces a fresh deck.
The result behaves like a hand-built deck for editing purposes but is generated in seconds.
FAQ
Do I need PowerPoint installed to use the output?
No — the .pptx file opens in PowerPoint, Keynote, Google Slides, LibreOffice Impress, or any PPTX-compatible tool. Even if you don't have PowerPoint, every modern Office-compatible suite renders the file correctly.
Can I edit individual charts in the deck? The charts are embedded as images — they can be moved, resized, and replaced, but not directly re-styled within PowerPoint. To change a chart, go back to the chat and request the re-render with the new style (different timeframe, different indicator, etc.). The new chart will be embedded into the next deck export.
Does this work for portfolios with A-share or HK holdings?
Yes. PickSkill recognises HKEx tickers (e.g. 9988.HK, 0700.HK) and A-share tickers (600519.SS, 000333.SZ) and pulls the right data sources per market. The deck adapts: A-share holdings get the MACD-on-A-shares interpretation overlay; limit-day bars are flagged as outliers in the technical sections.
How long is the download link valid? 7 days. The file itself is permanent once downloaded — re-generate from the chat at any time if you need a refreshed version. The download URL is scoped to your account; sharing the URL with someone outside your account does not work.
Can I generate the same deck in another language? Yes — add "in [language]" to the prompt. PickSkill supports the 8 locales used across the rest of the platform (English, Simplified Chinese, Traditional Chinese, Japanese, Korean, German, French, Spanish). The chart axis labels and indicator-bucket terminology are translated alongside the slide titles and body text.
Can I save the deck and come back to it later?
Yes — the chat session persists. Re-open the conversation and ask "re-generate the deck with today's data" and PickSkill builds a fresh .pptx with the latest readings. The session-history pattern means you can iterate on a single portfolio's deck over multiple sessions without restarting.