What Is Dividend Yield? The Number That Looks Simple but Isn't
Dividend yield = annual dividend per share / price. Formula, why high yield is often a warning sign, the payout ratio that matters, and four pitfalls.
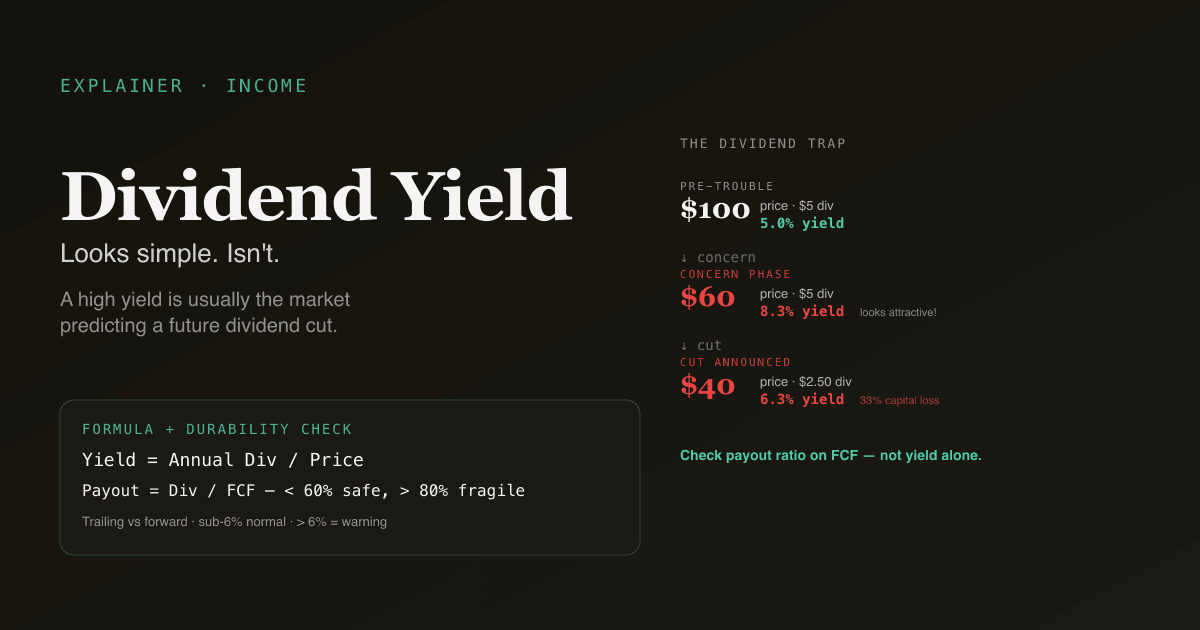
Dividend yield is the annual dividend per share divided by the current share price, expressed as a percentage. It is the number every income-focused investor checks first. It is also the number most often misread — a high dividend yield is frequently a warning sign, not a signal of opportunity. The yield is just a ratio; what determines whether it is real income is the durability of the dividend, which depends on the payout ratio, the free cash flow that funds it, and the business that generates the cash flow.
Key takeaways
- Formula:
Dividend Yield = Annual Dividend per Share / Current Share Price. Use trailing-twelve-month dividend or forward-twelve-month dividend; the two can diverge meaningfully for businesses that just changed policy. - Yield rises when price falls. A "yield spike" often reflects a falling price, not a rising dividend — the market is signalling concern.
- Payout ratio is the durability check:
Payout Ratio = Dividend / Net Income. Sub-50% is safe; 50–80% is normal; 80%+ is fragile. - Cash-flow-based payout (
Dividend / FCF) is more honest than earnings-based — net income can be smoothed; FCF is harder to fake. - The dividend trap: a 10% yield on a stock that cuts the dividend 50% next year is a 5% yield with a 50% capital loss. Not a bargain.
How is dividend yield calculated?
Two conventions in common use:
Trailing yield = Dividends paid (last 4 quarters) / Current price
Forward yield  = Annualized current quarterly dividend × 4 / Current price
Most platforms quote trailing yield by default. For companies that recently raised or cut dividends, the two diverge. Always check which version a quoted number refers to — a "5% yield" can mean very different things depending on whether the company raised dividends 50% this quarter (forward 5%, trailing 3.3%) or cut them 50% this quarter (trailing 5%, forward 2.5%).
For more on the cash-flow side that funds dividends, see What Is Free Cash Flow?.
Why high dividend yield is often a warning sign
The yield is a ratio: Dividend / Price. There are two ways for the yield to rise:
- Dividend goes up (rare; requires a board decision and signals confidence)
- Price goes down (common; signals concern)
Most "high yield" stocks are high-yield because the price has fallen. If the price fell because the market sees the dividend as at-risk of being cut, the high yield is a prediction of a future dividend cut, not a windfall.
A useful gut check: a yield above 6% in a sub-10-year-low-rate environment is roughly always one of three things:
- A real-estate investment trust (REIT) where the high payout is structural (REITs must distribute 90%+ of taxable income).
- A master limited partnership (MLP) where the structure forces high distributions.
- A regular company where the dividend is at meaningful risk of being cut.
For non-REIT, non-MLP businesses, sustained dividend yields above 6% are statistically much more likely to result in dividend cuts than dividend hikes.
What payout ratio actually tells you
The payout ratio is the most important durability metric for a dividend:
Earnings Payout Ratio = Dividends / Net Income
Cash Payout Ratio     = Dividends / Free Cash Flow
A simple framework for the cash payout ratio:
| Payout (% of FCF) | Interpretation |
|---|---|
| < 30% | Very safe — large cushion for buybacks, debt paydown, or future dividend hikes |
| 30–60% | Safe — typical for mature dividend payers |
| 60–80% | Normal for high-yield REITs and utilities; less normal for industrials |
| 80–100% | Fragile — small earnings declines force a cut |
| > 100% | Unsustainable — dividend is being funded by debt or asset sales, not cash flow |
The most common dividend cut precondition: cash payout ratio creeping above 100% for 2–3 consecutive quarters as FCF declines but the board has not yet cut. The boards almost always cut after, not before — by which point the share price has already moved.
The dividend trap
A "dividend trap" is a high-yield stock that cuts the dividend, producing a worst-of-both-worlds outcome: the income disappears, and the share price falls sharply on the cut announcement (typically 15–30%).
A typical dividend trap arithmetic:
| Stage | Price | Annual Div | Yield |
|---|---|---|---|
| Pre-trouble | $100 | $5 | 5.0% |
| Concern phase | $60 | $5 | 8.3% — looks attractive! |
| Cut announced | $40 | $2.50 | 6.3% — yield "recovered" |
The investor who bought at $60 for the "8.3% yield" now owns a $40 stock paying 4.2% on their cost basis ($2.50 / $60), with a 33% capital loss. The high yield was the market correctly predicting the cut, not an opportunity the market missed.
How to avoid: cross-check the cash payout ratio (>80% is fragile), check management commentary on dividend (defensiveness about it is a tell), and check the bond market — if credit spreads have blown out, equity is signalling dividend risk through bonds first.
Four pitfalls retail readers fall into
- Chasing yield without checking durability. A 7% yield with 90% payout ratio is meaningfully different from a 4% yield with 30% payout ratio. The latter is safer and has more room to grow; the former is fragile.
- Ignoring growth. A 2% yield growing 10% per year (a "dividend grower") compounds to a much higher yield on cost than a 5% yield that is flat. Over 10 years: 2% growing at 10% = 4.7% yield on original cost; 5% flat = 5% yield on original cost. Now extend to 20 years: 12% vs 5%. Growth wins.
- Comparing dividend yields without context. Sector matters: utility yields, REIT yields, and tobacco yields are all structurally higher than tech yields. Compare within sector and against the company's own historical range.
- Not stress-testing against a downturn. Will this dividend survive a 30% earnings decline? Run the math: if EPS falls 30%, what does the payout ratio become? If it crosses 80%, the dividend is at risk; if it crosses 100%, the dividend is mathematically unsustainable absent a balance-sheet rescue.
How dividend yield fits in a valuation framework
For income-focused investors, dividend yield combines with other multiples to form a complete picture:
| Multiple | What it captures |
|---|---|
| Dividend Yield | Current income |
| Dividend Growth Rate (5-yr CAGR) | Future income trajectory |
| Payout Ratio | Sustainability of the current dividend |
| P/E | Overall valuation |
| FCF Yield | Cash-generation power funding the dividend |
The "dividend aristocrats" framework (25+ years of consecutive dividend hikes) is essentially a high-quality-business screen using dividend durability as the proxy. The companies that have raised dividends through multiple recessions have, by selection, the most resilient cash flows.
Run dividend-yield analysis on your portfolio. In /chat, ask "for each holding, show forward dividend yield, payout ratio on net income and FCF, 5-year dividend growth, and the year of the most recent dividend cut if any." PickSkill pulls the data and flags any payout ratios above 80%.
How dividend yield behaves across markets
| Market | Typical S&P 500 / large-cap range | Notes |
|---|---|---|
| US S&P 500 | 1.2% – 2.0% headline; sector dispersion wide | Utilities 3–4%, REITs 3–6%, Tech 0.5–1.5% |
| HK / China large-cap | 2.5% – 4.5% | SOE-heavy structure produces higher payouts |
| A-share large-cap | 1.5% – 3.5% | Bank and SOE yields elevated; tech / growth yields near zero |
For A-shares specifically, dividend yield interacts with the regulatory regime: the China Securities Regulatory Commission has increased pressure on listed companies to pay dividends in recent years, particularly state-owned enterprises. The "高股息" (high dividend) theme has been a periodic market favorite, especially in lower-growth periods when investors rotate to income.
See Best Indicators for A-shares for the broader playbook on A-share-specific dynamics.
Common follow-up prompts
- "For my dividend-focused portfolio, show payout ratio on FCF and any holdings where payout has crossed 80% in the last 4 quarters."
- "Find S&P 500 dividend aristocrats with 5-year dividend growth above 8% AND forward P/E below 18."
- "Compare [ticker]'s current dividend yield to its 10-year median. Is the elevated yield a value opportunity or a yield trap?"
- "Build a watchlist of A-share high-dividend names with payout ratio below 60% AND 3-year dividend growth positive."
Further reading
- Investopedia on dividend yield — comprehensive reference.
- S&P Dow Jones Indices Dividend Aristocrats — methodology for the canonical durable-dividend benchmark.
FAQ
What is a "good" dividend yield? There is no universal answer — sector matters. A 1.5% yield is good for a tech company; a 5% yield is normal for a utility; a 7% yield is suspicious almost anywhere outside REITs and MLPs. The more useful question: is this yield higher than the company's historical median? If yes, dig into why — yield spikes are often warnings.
Why does dividend yield matter for total returns? Over the very long run, dividends have contributed roughly 40–50% of total S&P 500 returns (cumulative income reinvested). For long-term holders, dividend growth is a meaningful component of compound return — but the growth matters more than the level. A 2% yield growing 10% per year compounds to a much higher yield on original cost than a 5% yield that is flat.
Are dividends always better than buybacks? No — buybacks are more tax-efficient (no immediate tax event for the shareholder), and they let shareholders self-select into income vs reinvestment. Dividends are more rigid (cutting them is a major signal) and create forced taxable events. The "dividends vs buybacks" debate is mostly settled in favor of buybacks for tax-paying domestic shareholders. Dividend culture persists because of investor preference and the credibility-signal value of consistent dividend payments.
What is a dividend aristocrat? A US large-cap that has raised its dividend for 25+ consecutive years. The list (S&P 500 Dividend Aristocrats) is roughly 65 names. The screen is effectively a quality screen: businesses that have raised dividends through multiple recessions have, by selection, durable competitive positions and resilient cash flows. The names skew toward consumer staples, industrials, and healthcare — fewer tech names.
Should I reinvest dividends or take cash? For accumulation-phase investors, automatic reinvestment (DRIP) is mechanically simpler and forces dollar-cost averaging. For income-phase investors (retirement), taking cash makes sense. For tax-sensitive accounts, dividends are taxable on receipt regardless of whether you reinvest, so the tax bill is the same either way — the choice is purely about whether you want the cash now.