How to Find Oversold Stocks in 60 Seconds with PickSkill
Use the RSI dashboard to scan a portfolio or watchlist for oversold opportunities, filter for trend regime, and turn candidates into ranked entries.
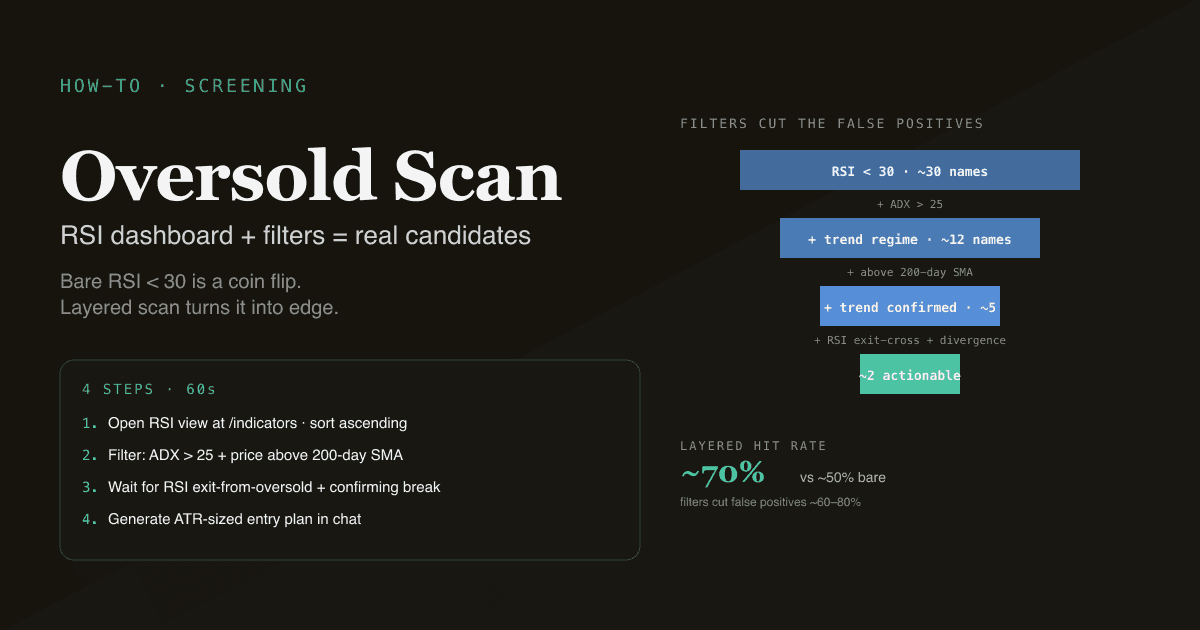
"Oversold" is one of the most-searched investing terms — and one of the most-abused. A simple RSI-below-30 filter looks like a great signal in retrospect on charts where it worked. Backtests show the bare oversold filter is a coin flip, because half of the "oversold" readings happen in clearly downtrending stocks where the oversold condition can persist for weeks. This tutorial walks through finding genuinely actionable oversold candidates in 60 seconds — combining the RSI signal with trend-regime filters and confirmation events that lift the per-signal edge meaningfully.
Key takeaways
- 4 steps, ~60 seconds. Open the RSI dashboard, sort by current RSI, filter by trend regime, layer confirmation before acting.
- Bare RSI < 30 is a coin flip. Adding ADX > 25 and a trend-direction filter cuts false signals by 40–60%.
- The cleanest setup: oversold + ADX strong + price above 200-day MA + bullish divergence in MACD.
- Watch for confirming events — RSI crossing back above 30 from below, or a price break above the most recent swing high.
- Works across US, HK, and A-share holdings with market-appropriate handling of limit-day bars.
Why this workflow matters
The "RSI below 30 = buy" rule is one of the most well-known signals in technical analysis. It also has a far worse track record than the literature suggests:
- In strongly trending bear markets, RSI can stay below 30 for weeks while the stock keeps falling. Acting at RSI = 28 means catching a falling knife.
- In choppy markets, RSI dips below 30 routinely on noise. Most of these dips revert quickly without producing tradeable moves.
- The cleanest oversold setups have additional structure: a confirmed trend regime, a clear support level nearby, and momentum starting to turn.
Without a tool that scans your portfolio for the combined setup, you cannot apply the layered filters efficiently. With the tool, the filter is one click and the candidate quality lifts substantially.
For the concept itself, see What Is RSI?.
The 4-step workflow
Step 1 — Open the RSI dashboard
Go to /indicators and select RSI. The dashboard scans every holding across your default portfolio (or any portfolio you select) and shows the current RSI reading, the 5-day RSI trail, and the bucket classification (oversold / oversold-recovering / neutral / overbought / overbought-fading).
Sort by RSI ascending. The lowest readings appear first.
Step 2 — Identify the candidates
The dashboard surfaces three categories of "low RSI":
| State | RSI value | Action |
|---|---|---|
| Oversold, still falling | < 25 and trail says "decreasing" | Wait — momentum still negative |
| Oversold, turning | < 30 and trail says "increasing" | Watchlist candidate |
| Oversold-exit | Crossed from < 30 back above 30 | Action candidate — confirming event |
The actionable bucket is "oversold, turning" or "oversold-exit." The "oversold, still falling" bucket needs more time. The simple "RSI < 30" filter conflates all three and is why the bare signal underperforms.
Step 3 — Layer the trend-regime filter
Before acting on any oversold candidate, check the trend regime:
- ADX must be above 25. Low ADX means range-bound chop; oversold signals there are roughly random.
- Price relative to 200-day MA: prefer candidates above their 200-day SMA (long-term uptrend with short-term pullback). Candidates below the 200-day are deep-value style setups requiring fundamental work.
- MACD context: prefer candidates where MACD has not yet made a new low at the same time as RSI (bullish divergence — see What is Divergence?).
Apply all three filters and the number of candidates drops by ~60–80%. The remaining ones are the higher-edge setups.
Step 4 — Generate an entry plan
Once a candidate passes the filters, use chat to generate a structured entry plan:
For [ticker], the RSI just exited oversold. Build me an entry plan:
- Current price vs the nearest support level
- Suggested entry (current vs limit-buy on pullback)
- Initial stop level using 2× ATR or below the most recent swing low
- Initial target based on the nearest resistance level
- Position size for 1% portfolio risk on a $100K account
PickSkill returns a structured plan with sourced levels, an ATR-sized position, and a risk-reward ratio. Adjust assumptions inline and re-run.
Try it now. Open /indicators, select RSI, and sort ascending. Even on a 10-name portfolio you'll likely see 1–3 oversold candidates per month — but the filtered candidates (oversold + ADX strong + above 200-day + divergence) are rarer and more actionable.
What the dashboard catches that manual scanning misses
1. The "exit" trigger vs the "in extreme" condition
Manual chart scanning often finds names with RSI = 28 and concludes "oversold, buy." The dashboard explicitly distinguishes between still falling and turning up — the latter is the actionable state. The distinction usually shows up 1–3 bars after the absolute RSI low, which is exactly when discretionary chart-watchers tend to act on raw "oversold" readings.
2. Multi-name simultaneous scanning
Hand-scanning works for a few names. The dashboard scans your full watchlist in seconds. Across a 30-name watchlist there is usually at least one actionable oversold-turning setup at any given time — finding it manually means looking at 30 charts.
3. Combined RSI + trend regime + divergence detection
The bare RSI signal is a coin flip; the layered signal has meaningful edge. The layered scan is impractical by hand because it requires checking three indicators on every name. Automation makes the multi-layer filter the default rather than an aspirational discipline.
Four pitfalls in the oversold workflow
- Acting on raw RSI < 30 without filters. Empirical hit rate is ~50% on the bare signal. Adding ADX and direction filters lifts it to 60–70%.
- Buying into clear downtrends. "Oversold" in a stock that has lost 50% in a month is usually not the bottom — it is a momentum stock that will continue lower. Respect the 200-day MA filter.
- Ignoring the exit event. Buying at RSI = 25 with the RSI still trending down means you may not see the bottom for 5–15 more bars. Wait for the cross above 30 (or at least the stabilization in the 5-day trail) before sizing in.
- Sizing without ATR. Oversold stocks are often higher-ATR than their normal regime. Using a fixed-percent stop (e.g., 5%) on an elevated-ATR stock means the stop is at a noise-level distance; using a 2× ATR stop sizes the trade to actual volatility.
How this applies on A-shares
A-share market dynamics change the oversold dynamics:
- Limit-down sequences can produce RSI readings below 20 over 3–5 consecutive bars, even when the stock has more downside. Pair the RSI filter with limit-day exclusion (the PickSkill A-share dashboards do this automatically).
- Day-trading restrictions (T+1) mean retail oversold buyers are committing to overnight risk. Position sizing matters more.
- Sector rotation in A-shares is faster than US equities: oversold candidates within a sector that is rotating out of favor often stay oversold for longer. Cross-check the sector trend.
See Best Indicators for A-shares for the broader playbook.
Common follow-up workflows
- "Show me oversold candidates across my full watchlist where ADX > 25 AND price is above the 200-day MA AND MACD shows bullish divergence — the high-edge stack."
- "For each oversold candidate, compute the 2× ATR stop and the nearest resistance level. Rank by risk-reward ratio."
- "Backtest the layered oversold setup (RSI < 30 → RSI > 30 cross + ADX > 25 + above 200-day) on the S&P 500 over the last 10 years. What's the hit rate?"
- "For my A-share holdings, exclude any names that have hit limit-down in the last 5 days from the oversold scan."
Further reading
- What Is RSI? — the underlying concept.
- Combining MACD, RSI, and ADX into a 3-indicator filter — the layered approach in detail.
FAQ
What RSI level counts as oversold? 30 is the conventional threshold but it is not magic. In strongly trending markets, 25 may be the working threshold; in choppy markets, 35 catches more usable setups. The PickSkill dashboards default to 30 for cross-market comparability.
Why does the bare "RSI < 30 buy" signal underperform? Because it conflates three different states: oversold-and-still-falling (the bottom hasn't formed), oversold-and-turning (the actionable state), and oversold-in-a-bear-market (where the condition persists for weeks). The layered filter (ADX + 200-day MA + divergence + cross-back-above-30) addresses each failure mode.
How long should I wait after RSI exits oversold? For most setups, the cross above 30 itself is the trigger. Waiting longer (e.g., RSI > 50) reduces the number of trades meaningfully but increases per-trade edge in trending markets. The trade-off is between catching more reversals (early) and catching only confirmed ones (late). The PickSkill dashboards surface both: the cross event and the "RSI > 50" confirmation.
Should I trade oversold setups on individual stocks or wait for market-wide oversold readings? Market-wide oversold (VIX > 30, SPY RSI < 30) is rarer but historically much higher-edge — you are catching dislocations rather than name-specific drawdowns. Stock-level oversold setups are more frequent but require name-specific judgment about whether the company is structurally fine vs in trouble.
Can I get email alerts when stocks in my portfolio become oversold? The scheduled-workflows feature (in design — see the workflows design doc) will support this. For now, the RSI dashboard is on-demand: open it when you want the scan, and you get the current state. Many users habitually check the RSI dashboard once a week as part of their routine portfolio review.