What Is ATR (Average True Range)? The Volatility Number That Sizes Positions
ATR measures average per-bar volatility. Formula, why it's the right tool for position sizing and stops, the ATR-multiple framework, and four pitfalls.
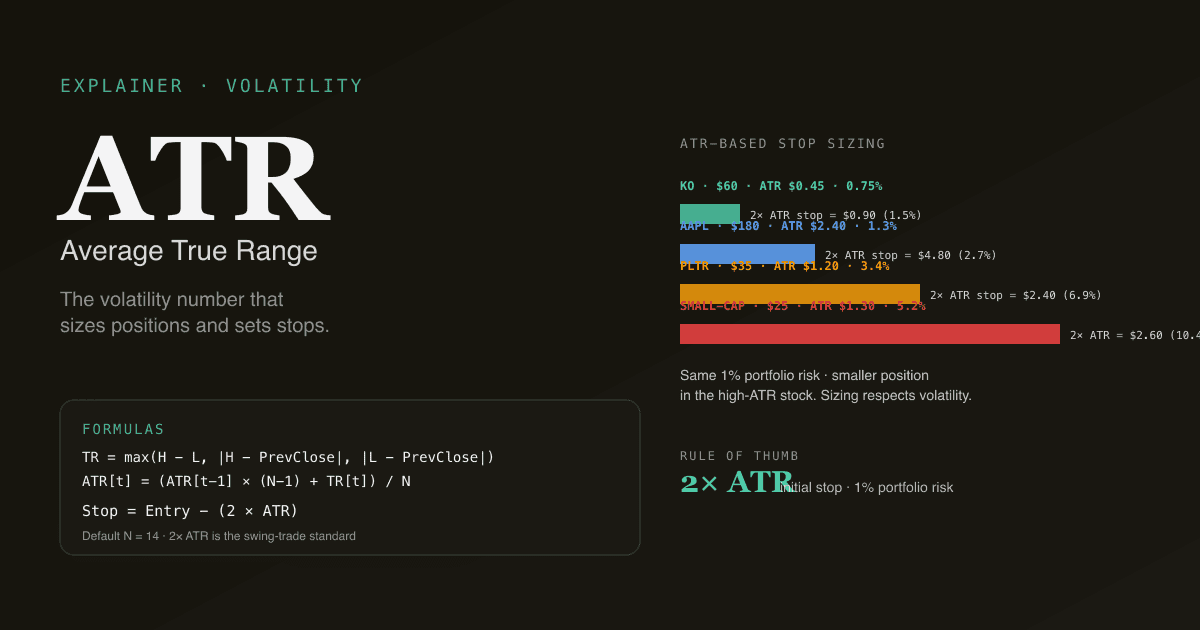
Average True Range (ATR) is the average of the "true range" over N bars, where true range captures the largest of (today's high − low), (today's high − yesterday's close), or (yesterday's close − today's low). It is the most important indicator most retail investors do not use. ATR does not give entry signals. It tells you something more useful: how much this stock moves in a typical bar, so you can size positions and set stops in a way that respects the underlying volatility. A 1% stop on a high-ATR stock and a 1% stop on a low-ATR stock are not the same trade.
Key takeaways
- Formula:
True Range = max(High − Low, |High − PrevClose|, |Low − PrevClose|). ThenATR(N) = average TR over the last N bars. Default N = 14 (Wilder's smoothing). - ATR is in dollar units (e.g., $1.85), not percent. The same stock at different prices has different ATR. ATR / Price gives the percent equivalent.
- Position sizing: a common rule is "1× ATR initial stop, 0.5–1% portfolio risk per trade." Bigger ATR = smaller position to keep dollar risk constant.
- Volatility regimes shift. A stock's ATR can double in months around earnings, macro shocks, or news. Recalibrate stops and sizing as the regime changes.
- ATR is direction-neutral. It says nothing about which way the stock is going. Pair with MA stack, MACD, or other directional tools.
How is ATR calculated?
The "true range" for each bar handles overnight gaps cleanly:
TR[t] = max(
  High[t] − Low[t],
  |High[t] − Close[t-1]|,
  |Low[t]  − Close[t-1]|
)
The first term is the bar's intra-day range. The second and third terms catch gap-up and gap-down openings respectively, where the actual price movement from the prior close was larger than the bar's own range. The "true" qualifier in true range means: the largest plausible move, including gaps.
Then ATR averages over N bars with Wilder's smoothing (the same exponential smoothing used in RSI):
ATR[t] = (ATR[t-1] × (N-1) + TR[t]) / N
Default N = 14 across virtually every platform. Wilder's smoothing means each new TR has weight 1/N (~7.1% at N = 14), with the residual carried forward.
What does ATR actually tell you?
ATR is a dollar amount: "$1.85 ATR on a $100 stock" means the typical bar's movement (including overnight gaps) is $1.85. That is more directly useful than percent volatility for several reasons:
- Stops are dollar-amount events. Whether your stop is hit depends on dollar moves, not percent moves.
- Risk-per-share is the right unit for sizing. Dollar ATR = expected dollar move per share = the right per-share risk reference.
- Cross-stock comparison is more honest in ATR%. Divide ATR by current price to get ATR% — directly comparable across stocks at different price levels.
| Stock | Price | ATR | ATR% | Interpretation |
|---|---|---|---|---|
| Mega-cap (e.g. KO) | $60 | $0.45 | 0.75% | Low volatility — large stable business |
| Tech large-cap (e.g. AAPL) | $180 | $2.40 | 1.3% | Moderate volatility |
| Growth name (e.g. PLTR) | $35 | $1.20 | 3.4% | Higher volatility |
| Small-cap | $25 | $1.30 | 5.2% | High volatility — wider stops needed |
The pattern: large, stable businesses have low ATR%; small, growth, or news-driven names have high ATR%. The cross-stock differences are large and they matter for sizing.
The ATR-multiple framework for stops
The most common practical use of ATR is setting initial stop losses at a multiple of ATR:
- 1× ATR stop: Tight. Useful for high-conviction setups where you want minimum room for noise. Hits stop frequently.
- 2× ATR stop: Standard. Most swing-trading systems use 2× ATR as the default. Filters out routine noise; catches genuine reversals.
- 3× ATR stop: Wide. Used for long-term position trades where you want to survive moderate corrections.
Example with $180 AAPL, ATR = $2.40:
| Stop | Stop Distance | Stop Price | Risk per share |
|---|---|---|---|
| 1× ATR | $2.40 | $177.60 | $2.40 |
| 2× ATR | $4.80 | $175.20 | $4.80 |
| 3× ATR | $7.20 | $172.80 | $7.20 |
For a 1% portfolio risk per trade on a $100K account ($1,000 risk budget):
| Stop multiple | Shares (risk = $4.80/share at 2× ATR) | Position dollar size |
|---|---|---|
| 2× ATR ($4.80 risk/share) | $1,000 / $4.80 = 208 shares | 208 × $180 = $37,440 |
The ATR-multiple framework automatically sizes smaller positions in high-ATR stocks and larger positions in low-ATR stocks, keeping dollar risk per trade constant. This is the simplest meaningful upgrade to fixed-share-size or fixed-dollar-size sizing.
Why volatility regimes matter
ATR is not static — it shifts over time as the volatility regime shifts. Three patterns to recognize:
-
Earnings expansion: ATR typically rises 50–100% in the 2–3 sessions around an earnings release, then settles back. Stops set on pre-earnings ATR can get hit by routine earnings-day moves.
-
Macro shock expansion: ATR for the whole market widens during VIX spikes (rate decisions, geopolitical events, banking stress). A 14-bar ATR will reflect this within 7–10 sessions; positions held into the regime should resize.
-
Compression before breakout: a falling ATR for many consecutive weeks often precedes a sharp directional move. The "ATR squeeze" pairs naturally with the Bollinger Band squeeze — both measure the same coiling phenomenon.
The PickSkill dashboards surface ATR as a tracked metric so you can see regime shifts at a glance.
Four pitfalls in using ATR
-
Setting stops without ATR. Fixed-percent stops (e.g., "always 5% stop") ignore the fact that 5% on a quiet stock and 5% on a volatile stock are very different in terms of how often the stop hits noise vs real reversals. ATR-based stops are noise-aware.
-
Using ATR for direction. ATR is direction-neutral by construction — it tells you how much the stock moves, not which way. Treating "high ATR" as bearish or "low ATR" as bullish is a category error. Pair with directional tools.
-
Not adjusting ATR for the regime. ATR computed on the last 14 calm-market bars under-states the volatility you will face in the next regime. After a regime shift (earnings, news, macro), give ATR 7–10 bars to reflect the new normal before sizing into new positions.
-
Confusing ATR with realized volatility (sigma). Both measure volatility but with different math. Realized volatility is the standard deviation of daily returns and is what option pricing uses. ATR is the average true range and is more intuitive for stops and sizing. They generally agree on direction but the numbers are not interchangeable.
How ATR fits in a multi-signal workflow
ATR is the volatility layer that sizes everything else:
| Layer | Tool | Question answered |
|---|---|---|
| Direction | MA stack, MACD, trend filter | Which way is the market? |
| Setup | Divergence, support/resistance | Is there an actionable pattern? |
| Trigger | %K cross of %D, MACD line cross | When to act? |
| Volatility / sizing | ATR | How big should the position be? Where should the stop sit? |
| Confirmation | Volume, capital flow | Is the move backed by participation? |
The most-skipped layer in retail trading is volatility. Without it, position sizes are arbitrary and stops are either too tight (whipsawed) or too wide (oversized losses).
How ATR behaves on A-shares
A-share market microstructure changes ATR's interpretation:
- Limit-up/limit-down days cap the bar's range at the limit price (±10% on main board). On a limit day, the true range is exactly the limit move; ATR computed on consecutive limit days will overshoot true volatility. The PickSkill A-share dashboards flag limit-day bars as outliers.
- T+1 settlement compresses intraday volatility into next-session opens. A-share gap-day frequency is higher than US large-cap; the gap-handling in the true range formula matters more.
- Halts create discontinuities. Post-halt ATR readings should be discounted for the first 5–10 bars.
See Best Indicators for A-shares for the broader market-specific playbook.
See ATR on your portfolio. In /chat, ask "for each holding, show current ATR, ATR%, and the change vs 60-day average. Flag any where ATR is more than 1.5× its 60-day average — those are regime-shifted names that need stop-loss recalibration."
Common follow-up prompts
- "For [ticker], compute the 2× ATR stop and tell me how many shares I should hold for 1% portfolio risk."
- "Find S&P 500 names where ATR has compressed by 30%+ over the last 8 weeks — Bollinger-squeeze candidates."
- "Compare current ATR for my holdings to their 12-month range. Which are at low-vol extremes (potential breakout) vs high-vol extremes (avoid for now)?"
- "Backtest a 2× ATR trailing stop on [ticker] over the last 5 years. How does it compare to a fixed-5% stop?"
Further reading
- Investopedia on ATR — comprehensive reference.
- J. Welles Wilder Jr., New Concepts in Technical Trading Systems — developer's original treatment of true range and ATR.
FAQ
Should I use ATR or standard deviation for volatility? ATR for stops and position sizing — it is in dollar units and directly applicable. Standard deviation (or annualized realized volatility, σ) for option pricing and statistical analysis — it is in percent units and assumes normality. The two generally agree on direction but answer different questions.
What's the right ATR multiple for stops? 2× ATR is the most common starting point for swing trades. 1× ATR is tight (frequent stop hits, suitable for very-high-conviction setups). 3× ATR is wide (used for position trades where you want to survive moderate corrections). The choice depends on holding period and personal tolerance for whipsaw vs oversized losses.
Why is ATR in dollar units instead of percent? ATR was designed by Wilder to be applied to commodity futures, where dollar-denominated risk is the natural unit. For equities, dollar ATR is still the right unit for stops and sizing decisions (your stop is a dollar event, not a percent event). For cross-stock comparison, divide ATR by current price to get ATR%.
How does ATR relate to Bollinger Band width? Both measure volatility but with different formulas. Bollinger bandwidth uses standard deviation of close; ATR uses true range (which includes gaps). When the two diverge (ATR rising but bandwidth falling), it usually signals gap-driven volatility — the daily ranges are widening but the closing prices are still within a tight band. This is a useful regime-detection signal.
Should I adjust ATR for stock splits? Yes — any per-bar price-based indicator needs split adjustment for historical comparison. Most platforms handle this automatically; manual ATR calculations on raw historical data without split adjustment will produce false regime shifts on split dates. The PickSkill dashboards use split-adjusted prices throughout.