What Is the Stochastic Oscillator? %K, %D, and Why KDJ Is Its Cousin
Stochastic measures where close sits within the recent range. Formula, fast vs slow stochastic, the relationship to KDJ, and four pitfalls retail readers fall into.
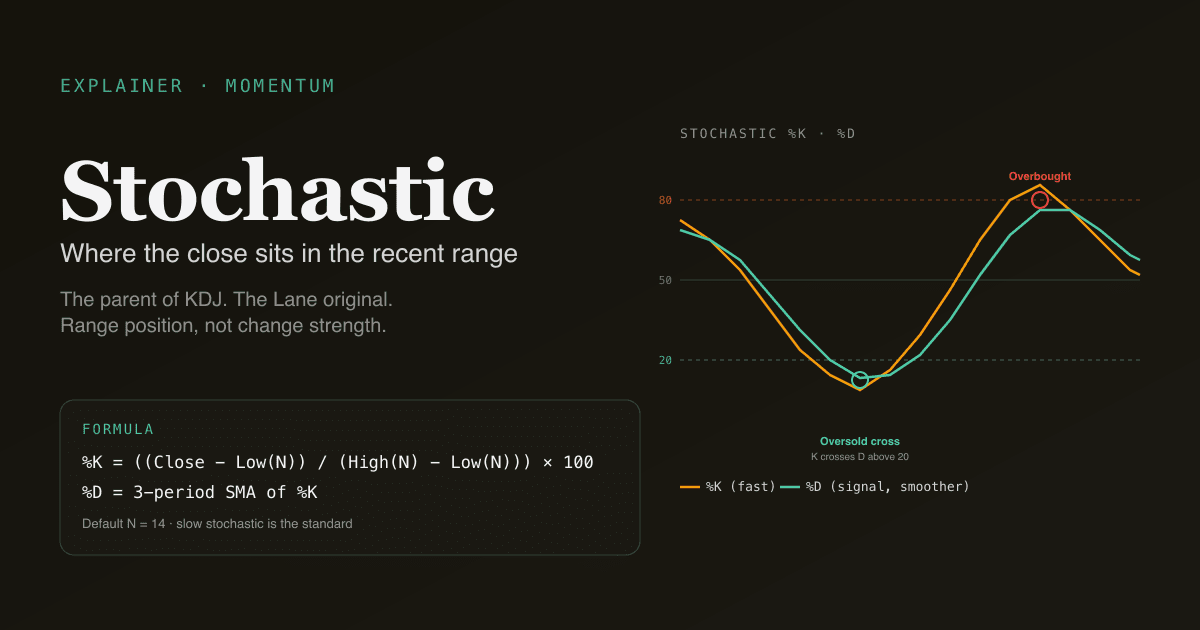
The stochastic oscillator measures where the current close sits within the recent high-low price range, on a 0–100 scale. It was developed by George Lane in the 1950s to answer a deceptively simple question: in a defined window, how close to the high (or low) is the current price? Stochastic is the parent of an entire family of momentum tools — including KDJ, which is essentially stochastic with an added J line and is the default oscillator in the Chinese A-share retail community. Knowing the parent helps you read every variant.
Key takeaways
- Formula:
%K = ((Close − Low(N)) / (High(N) − Low(N))) × 100. Default N = 14 in US convention. - Two lines: %K (the raw stochastic) and %D (3-period SMA of %K, the signal line). When %K crosses %D, that is the basic signal.
- Overbought above 80, oversold below 20. Same thresholds as RSI but built from a different formula (range position, not change strength).
- Fast vs slow stochastic: fast is more responsive but noisier; slow is the smoothed standard. Most platforms default to slow.
- KDJ extends stochastic with a J line (
J = 3K − 2D). The J line can overshoot beyond 0 or 100, which is why KDJ is more popular in markets with sharper swings (A-shares).
How is the stochastic oscillator calculated?
The full math for the most common form (slow stochastic):
Raw %K = ((Close − Low(N)) / (High(N) − Low(N))) × 100
%K     = 3-period SMA of Raw %K
%D     = 3-period SMA of %K
Default N = 14 in the US convention; KDJ uses (9, 3, 3) in the A-share convention. The smoothing reduces noise — the un-smoothed "fast stochastic" is too sensitive for daily-bar use on most equities.
The output is bounded 0–100 by construction:
- %K = 100 means the close is at the highest price of the last N bars (maximum strength)
- %K = 0 means the close is at the lowest price of the last N bars (maximum weakness)
- %K = 50 means the close is exactly in the middle of the recent range
This makes stochastic fundamentally different from RSI, which measures the strength of recent price changes, not the position in a range. The two often agree but for slightly different reasons.
Fast vs slow stochastic — what's the difference?
Three flavors of stochastic exist, in increasing order of smoothing:
| Variant | Raw %K | %K (output) | %D | Use case |
|---|---|---|---|---|
| Fast | Raw | Raw | 3-SMA of %K | Active traders, intraday |
| Slow | Raw | 3-SMA of Raw | 3-SMA of %K | Standard for daily bars |
| Full | Raw | N-SMA of Raw (configurable) | M-SMA of %K (configurable) | Custom optimization |
The "stochastic oscillator" without qualifier almost always refers to the slow version. Fast stochastic generates too many false signals on daily bars to be useful for most retail timeframes; it has a place on intraday charts where the noise floor is higher.
What do overbought and oversold mean here?
The 80/20 thresholds work similarly to RSI's 70/30:
- Stochastic > 80: close is in the top 20% of the recent N-bar range — uptrend with strong recent momentum.
- Stochastic < 20: close is in the bottom 20% of the recent range — downtrend with weak recent momentum.
The key behavioral nuance: in a strongly trending market, stochastic can pin at or above 80 (in an uptrend) or below 20 (in a downtrend) for many consecutive bars. Treating "stochastic > 80" as automatically "overbought to sell" loses money in trending markets. The signal is more useful at the exit from an extreme — %K crosses below 80 from above for sell signals, %K crosses above 20 from below for buy signals.
Stochastic vs KDJ — what's the difference?
KDJ is stochastic with one addition: the J line.
| Component | Formula | Range |
|---|---|---|
| K (KDJ) | Same as slow stochastic %K | 0–100 (bounded) |
| D (KDJ) | Same as slow stochastic %D | 0–100 (bounded) |
| J (KDJ) | 3K − 2D | Unbounded — can go below 0 or above 100 |
The J line's unbounded property is the entire reason KDJ exists as a separate indicator. When the market is in a sharp move, J overshoots beyond 0 or 100, which acts as an early extreme signal — typically 1–3 bars before K and D show the same extreme.
KDJ is the default oscillator in the Chinese A-share retail community for two reasons:
- A-share daily price limits (±10% on main board, ±20% on ChiNext/STAR) create sharper bar-by-bar swings than US daily bars. The J line's overshoot captures these sharper moves more cleanly than RSI does.
- Cultural coordination — because the A-share retail community uses KDJ as the default, the signals are partly self-fulfilling on A-share names.
For a deeper comparison, see What Is KDJ? and KDJ vs RSI.
Four pitfalls in reading stochastic
- Fading the trend with stochastic. "Stochastic is above 80, so sell" loses money in uptrends. In trending markets, stochastic pins at extremes for many bars; the right signal is the exit from the extreme combined with a confirmation event (price break, momentum cross), not the extreme itself.
- Using stochastic on choppy stocks. Low-momentum, high-noise tickers generate dozens of stochastic crosses per quarter, most of which are noise. Use stochastic on names with reasonable trend persistence — same criteria as MACD and other momentum oscillators.
- Ignoring the trend regime filter. Stochastic without a trend filter is mostly noise. When ADX is below 20, stochastic signals are coin flips. When ADX is above 25 with a clear trend direction, stochastic signals at extremes have meaningful edge.
- Confusing stochastic with stochastic RSI. Stochastic measures price position in range; stochastic RSI (StochRSI) measures RSI position in its own range. They sound similar but measure different things and respond differently. The default "stochastic" in most platforms is the original Lane stochastic, not StochRSI.
How stochastic behaves on A-shares
A-share microstructure makes stochastic (and KDJ) particularly sensitive:
- Limit-up days cap the close at the limit price, which is mechanically the high of the bar's range. Stochastic %K on a limit-up day is at or near 100 by construction, regardless of broader trend context. PickSkill flags limit-day bars as outliers in the indicator dashboards.
- Halt days freeze the calculation. When the stock resumes after a multi-day halt, the lookback window includes the pre-halt period, which may no longer be relevant — treat post-halt stochastic readings with caution for the first 5–10 bars.
- T+1 settlement means same-day round-trips are impossible. This compresses intraday volatility into the next session's opening — making A-share stochastic signals more event-driven and less continuous than US daily-bar stochastic.
See Best Indicators for A-shares and MACD on A-Shares vs US Stocks for the broader market-specific context.
See it on your portfolio. The /indicators page renders KDJ (the most-used stochastic variant in the PickSkill universe) across every holding, with K, D, and J lines plus the 5-day bucket trail.
How stochastic fits in a multi-signal workflow
Stochastic is one input in a layered workflow:
| Layer | Tool | Question answered |
|---|---|---|
| Trend filter | MA stack + ADX | Is there a trend? Is it strong enough to trade? |
| Momentum / oscillator | Stochastic / KDJ / RSI | Where is the move in its momentum cycle? |
| Confirmation | %K crossing %D, MACD cross | When to act? |
| Level / map | Support / resistance | Where are the key levels? |
The cleanest entry setup: trend confirmed (ADX > 25, MA stack aligned), stochastic exits oversold from below 20, %K crosses %D upward, price breaks a recent swing high — four signals aligned. Skipping any of the four reduces the per-signal edge meaningfully.
Common follow-up prompts
- "For each holding, show current KDJ values plus 5-day trail. Flag any where K exited oversold and J is rising fast."
- "Compare stochastic and RSI signals across my A-share watchlist. Which names have both at extremes?"
- "Find S&P 500 names with stochastic %K exiting oversold AND a 50-day MA cross above 200-day MA — bullish reversal candidates."
- "Backtest the stochastic %K cross of %D from oversold on [ticker] over the last 5 years. What's the hit rate?"
Further reading
- Investopedia on the stochastic oscillator — comprehensive reference.
- George Lane's original work on stochastic — developer's own treatment of the indicator.
FAQ
Stochastic vs RSI — which is better? Neither — they measure different things. RSI captures the strength of recent price changes; stochastic captures position within the recent price range. In trending markets, RSI tends to be more useful (it can ride a trend without false reversals). In range-bound markets, stochastic tends to be more useful (it cleanly identifies range extremes). The PickSkill dashboards run both so you can compare. See KDJ vs RSI for a deeper treatment.
Why does my chart show different stochastic values than another platform? Two common causes: (1) different periods (14 vs 9 for %K, 3 vs 5 for the smoothing of %D), and (2) fast vs slow variant. The PickSkill dashboards use the standard slow stochastic with default periods to match the most common platform convention.
What's the relationship between stochastic and KDJ?
KDJ is slow stochastic with an added J line (J = 3K − 2D). The K and D math is identical between the two. KDJ's J line is the only addition, and it provides early-warning signals via overshoot beyond 0 or 100. Stochastic is the dominant convention in the US; KDJ is the dominant convention in the A-share retail community.
Can stochastic predict direction? Stochastic identifies extremes and crosses; it does not predict absolute direction in isolation. A stochastic crossing up from oversold tells you momentum has turned positive at this specific extreme; it does not tell you the larger trend will resume. Pair stochastic signals with a trend filter (MA stack + ADX) and a confirmation event (price break, MACD cross) before acting.
Should I use stochastic on intraday charts? You can, but reduce expectations. Intraday stochastic generates many signals per session, most of which are noise. Use intraday-style periods (5 or 7 instead of 14) and require multi-signal confirmation. Most retail intraday work over-uses stochastic relative to its actual edge.