What Is EPS (Earnings Per Share)? The Number Wall Street Actually Watches
EPS = net income / diluted share count. Formula, the GAAP vs adjusted distinction, why diluted matters, and four pitfalls retail readers fall into.
Earnings per share (EPS) is net income divided by the weighted-average diluted share count, reported every quarter alongside revenue. It is the single most-watched fundamental number in equities — the line that drives consensus, the line that defines the "beat" or "miss" headline, the line baked into every relative-valuation multiple. Most retail guides describe EPS as if it were one number. It is actually three: GAAP, adjusted, and diluted-vs-basic. Knowing which version you are looking at changes the conclusion.
Key takeaways
- Formula:
EPS = Net Income / Weighted-Average Diluted Shares Outstanding. Use diluted, not basic — diluted is the realistic count after options, RSUs, and convertibles. - GAAP vs adjusted: GAAP EPS follows accounting rules; adjusted (non-GAAP) EPS strips out items management deems "non-recurring." The gap is usually stock-based compensation, restructuring, and acquisition amortization.
- The "beat or miss" reference is consensus EPS — the median of sell-side analyst estimates published 1–6 weeks before earnings. A 1¢ beat moves stocks; a 1¢ miss can erase 10% of market cap.
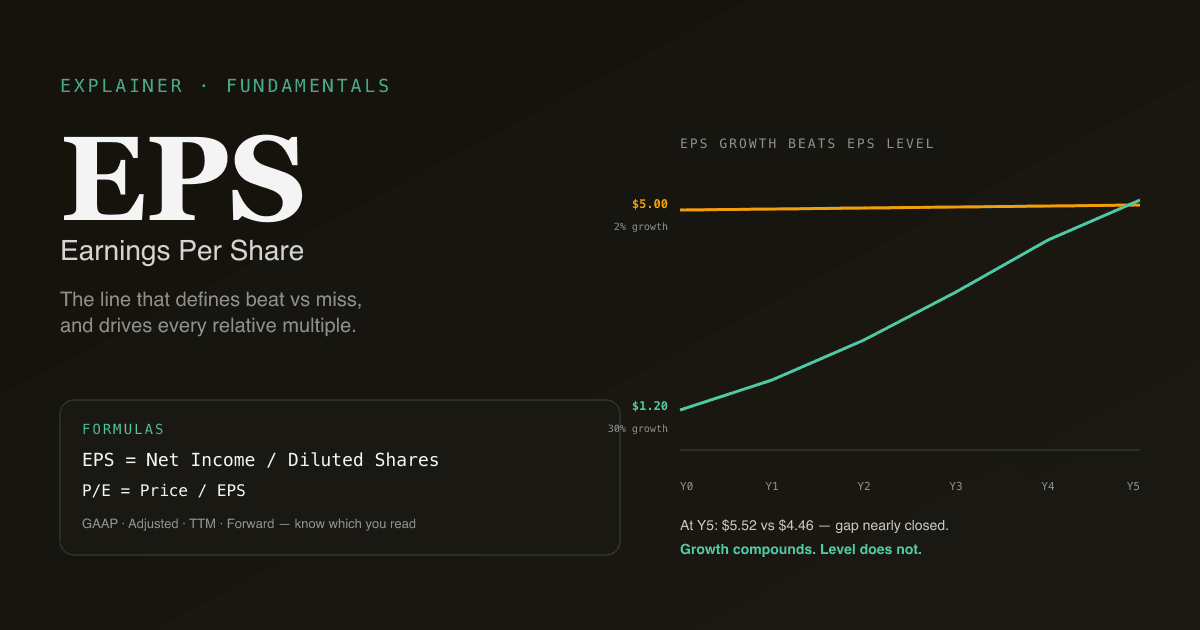
- EPS growth is more important than EPS level. A $1.20 EPS growing 30% YoY is worth far more than a $5.00 EPS growing 2%.
- Pairs naturally with P/E, DCF, and FCF — EPS is the numerator of the multiple and a key input to nearly every valuation framework.
How is EPS calculated?
Three definitions, in order of usefulness:
| Variant | Formula | When it matters |
|---|---|---|
| Basic EPS | Net income / basic share count | Almost never — ignores dilution from options and convertibles |
| Diluted EPS | Net income / diluted share count | The standard reference — what consensus tracks, what multiples use |
| Adjusted EPS | Adjusted net income / diluted share count | Management's preferred narrative — useful as a secondary read |
The diluted share count adds in:
- Stock options that are currently in-the-money (treasury stock method)
- RSUs and PSUs scheduled to vest
- Convertible notes and preferred shares that could convert to common
- Warrants outstanding
For companies with heavy stock-based compensation (most large-cap tech), diluted share count grows 1–3% per year even without any new issuance. Net income that is flat YoY translates to EPS that is down 1–3% — and the market reads the EPS line, not the net income line.
For more on what feeds into the numerator, see What Is Free Cash Flow? — FCF and net income diverge meaningfully for many businesses.
What does "GAAP vs adjusted" really mean?
US-listed companies report two EPS numbers every quarter:
- GAAP EPS follows the rules in US Generally Accepted Accounting Principles. The number is defined; companies cannot tweak it.
- Adjusted (non-GAAP) EPS is management's definition. Common adjustments: add back stock-based compensation, exclude restructuring charges, exclude acquisition-related amortization, exclude one-time tax items.
The gap between GAAP and adjusted matters because:
- Consensus tracks adjusted. When you see "beat by $0.05 vs consensus $1.20," that is adjusted EPS.
- Management has narrative latitude on adjusted. Defining "one-time" is judgment-driven; the same restructuring charge can show up for 8 consecutive quarters.
- The SEC requires the GAAP reconciliation. Every adjusted EPS in a press release must reconcile back to GAAP — read the reconciliation table to see what was added back.
The single biggest "adjustment" for most large-cap tech: stock-based compensation. SBC is a real economic cost (current shareholders are diluted to pay employees), but management's adjusted EPS adds it back as if it were free. Treating adjusted EPS as the "true" earnings number on a heavy-SBC business overstates earnings by 15–30% in many cases.
Why EPS growth matters more than EPS level
A common retail mistake: comparing the absolute EPS of two companies and concluding the higher-EPS company is the better business. The level of EPS is determined by the company's share count, which is essentially arbitrary. The growth rate of EPS captures the actual business trajectory.
| Company | EPS (Y0) | EPS growth (5-yr) | Implied EPS (Y5) |
|---|---|---|---|
| A | $5.00 | 2% | $5.52 |
| B | $1.20 | 30% | $4.46 |
Company A starts with 4× the EPS, but after 5 years of compound growth, Company B has closed most of the gap and is growing 15× faster. At market multiples (say 25× forward earnings), Company B's future market cap will grow much faster than Company A's — which is what determines investor returns.
The same logic explains why high-multiple growth stocks can be expensive on current EPS and cheap on future EPS. If you are not modelling forward EPS growth, you are looking at half the picture.
Four pitfalls retail readers fall into
- Reading adjusted EPS as the "real" number. Adjusted EPS is management's narrative. For heavy-SBC businesses, GAAP EPS is closer to economic reality. For asset-heavy businesses with large amortization from acquisitions, adjusted EPS may be closer to ongoing cash earnings. Read both.
- Comparing EPS across companies with very different capital structures. A company with massive buybacks has shrinking share count, which inflates EPS growth even if net income is flat. A company doing dilutive equity raises has rising share count, depressing EPS growth even if net income is rising. EPS growth is partly a capital-allocation story.
- Trading the EPS beat/miss as the verdict. Stocks move on EPS and revenue and guidance for the next quarter and margin trajectory. A 5¢ beat with a soft guide often sells off; a 2¢ miss with raised guidance often rallies. The headline alone is not the trade.
- Ignoring share count dynamics. The denominator changes over time — sometimes by 5–10% per year. Track the diluted share count quarterly; an EPS that "grew" 8% with 8% share count reduction is zero growth in net income.
How EPS feeds into valuation
EPS is the foundational input to most multiples:
| Multiple | Numerator | EPS dependency |
|---|---|---|
| P/E | Price | Direct — denominator is EPS |
| Forward P/E | Price | Next-12-month estimated EPS |
| PEG | P/E | EPS growth rate as divisor |
| EV/EBITDA | Enterprise value | EBITDA correlates with EPS but excludes capital structure |
For absolute valuation, EPS feeds the discounted cash flow model indirectly: net income drives free cash flow which drives the DCF output. The DCF framework respects accruals more carefully than EPS does, which is why heavy-acquisition companies sometimes look very different on EPS vs DCF.
Run EPS analysis on your portfolio. In /chat, ask "for each holding in my tech portfolio, show me the last 8 quarters of GAAP EPS, adjusted EPS, and YoY growth — flag any where adjusted-to-GAAP gap is widening." PickSkill pulls the data from the most recent 10-Qs and renders the table.
How EPS behaves differently across markets
| Market | Convention | Notes |
|---|---|---|
| US large-cap | Quarterly diluted EPS, both GAAP and adjusted reported | Adjusted is the consensus reference |
| HK | Half-yearly basic and diluted EPS | Quarterly reporting is not required; adjusted EPS less prevalent |
| A-shares | Quarterly basic and diluted EPS (扣非 / non-recurring exclusion) | "扣非净利润" is the de-facto adjusted variant — required disclosure |
For A-shares specifically, the "扣非净利润" (net income excluding non-recurring items) line is the closest analog to US adjusted EPS, but it is more rule-bound — the exchange defines what counts as non-recurring, not management. This makes A-share adjusted EPS more comparable across companies than US adjusted EPS.
See Best Indicators for A-shares for the broader market-specific playbook.
Common follow-up prompts
- "Show me the 8-quarter trend in GAAP vs adjusted EPS for [ticker]. Is the gap widening?"
- "How much of [ticker]'s EPS growth is share-count reduction vs net income growth?"
- "For each holding, compare consensus EPS for next quarter to my own DCF-implied EPS."
- "Find S&P 500 names with EPS growth above 20% over the last 3 years AND positive free cash flow growth."
Further reading
- Investopedia on EPS — comprehensive reference for the standard formula and variants.
- The SEC's investor education on non-GAAP measures — primary source on how adjusted EPS is regulated.
FAQ
Is a higher EPS always better? Not in isolation. EPS level is determined by share count, which is arbitrary; the same company with a 10-for-1 split has 10× the EPS but identical economics. What matters is EPS growth rate, quality (high-margin earnings vs low-margin), and durability (does growth come from price, volume, or margin expansion). A $5 EPS growing 2% per year is worth less than a $1 EPS growing 25% per year.
Why do GAAP and adjusted EPS often differ so much? The single largest cause is stock-based compensation — many tech companies pay 10–25% of revenue in equity that GAAP requires to be expensed but adjusted EPS adds back. Other common drivers: acquisition amortization (real economic cost stretched over years), restructuring charges (recurring at some companies), and one-time tax items. The SEC requires every adjusted EPS to reconcile to GAAP in the press release; that reconciliation is the cleanest way to see what management is excluding.
Should I use forward EPS or trailing EPS for valuation? For high-growth businesses, forward EPS is more relevant — the company you are buying is the company in 12 months, not the one in the rearview. For stable, mature businesses, trailing EPS is more reliable because forward estimates carry analyst-error risk. Most valuation frameworks use both: forward for the headline multiple, trailing as a sanity check on accuracy.
How accurate are analyst EPS estimates? For large-cap, well-covered names, consensus EPS is typically within ±2% of actual in stable quarters. Around inflection points (margin compression, demand shock, transformation), consensus can be 10–20% off. The standard deviation of estimates across analysts (consensus dispersion) is itself a signal — high dispersion = high uncertainty = bigger post-earnings moves regardless of direction.
What is EPS dilution and why does it matter? Dilution is the increase in share count from stock options exercising, RSUs vesting, convertibles converting, and equity raises. For a company with 1B shares and 30M RSUs vesting per year, dilution is 3% annually — meaning net income must grow 3% just to keep EPS flat. For heavy-SBC tech companies, dilution can be 5–10% per year, which is a meaningful headwind to EPS growth that the GAAP earnings number captures and adjusted does not.