What Is the Ichimoku Cloud? A Complete Trading System in One Indicator
Ichimoku is a 5-line system measuring trend, momentum, and support/resistance simultaneously. The Cloud, the 5 components, and how to actually use it.
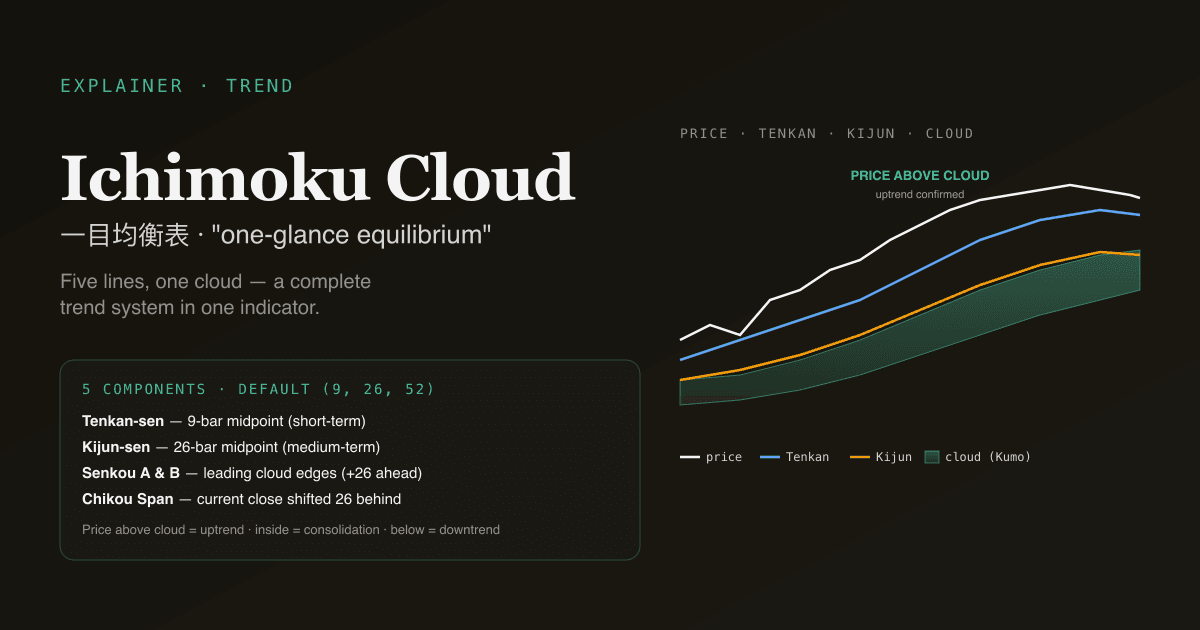
Ichimoku Kinko Hyo ("one-glance equilibrium chart") is a Japanese technical system that overlays five lines on a price chart to measure trend, momentum, and support/resistance simultaneously. It looks intimidating at first — most retail charting platforms render it as a colourful cloud with multiple overlapping lines — but the underlying logic is more disciplined than most popular indicators. It is the default trend system in Japan, has meaningful adoption in HK and Korea, and surprisingly little uptake in US retail despite being one of the most-cited "complete systems" in technical analysis literature.
Key takeaways
- Five components: Tenkan-sen (conversion), Kijun-sen (base), Senkou A & B (the cloud), Chikou (lagging close).
- The Cloud (Kumo): shaded area between Senkou A and Senkou B, plotted 26 bars ahead. Price above the cloud = uptrend; below = downtrend; inside = consolidation.
- Cloud thickness measures conviction: thick cloud = strong support/resistance; thin cloud = vulnerable to breakout.
- The whole system answers one question at a glance: where is price relative to the recent equilibrium, and which way is the equilibrium moving?
- Default parameters (9, 26, 52) are tied to historical Japanese trading-day counts and remain the standard worldwide.
The five components
Each line answers a specific question:
| Line | Formula | Period | Question answered |
|---|---|---|---|
| Tenkan-sen (転換線, "conversion") | (Highest High + Lowest Low) / 2 | 9 bars | Short-term equilibrium |
| Kijun-sen (基準線, "base") | (Highest High + Lowest Low) / 2 | 26 bars | Medium-term equilibrium |
| Senkou Span A (先行スパンA) | (Tenkan + Kijun) / 2, plotted 26 bars ahead | — | Leading edge of the cloud, fast |
| Senkou Span B (先行スパンB) | (Highest High + Lowest Low) / 2 over 52 bars, plotted 26 bars ahead | 52 bars | Leading edge of the cloud, slow |
| Chikou Span (遅行スパン, "lagging") | Current close, plotted 26 bars behind | — | Confirmation of trend strength |
The cloud (Kumo) is the area between Senkou A and Senkou B. When Senkou A is above Senkou B, the cloud is bullish-coloured (typically green); when below, bearish (typically red).
The default periods 9 / 26 / 52 derive from historical Japanese trading conventions (markets used to trade Saturdays — a 6-day week made 26 bars exactly one month). Despite the historical accident, the periods produce a balanced trend system that has held up across decades on daily bars in most major equity markets.
The four core signals
Ichimoku produces several signals; four are dominant:
1. Price vs Cloud
- Price above the cloud: uptrend regime confirmed.
- Price below the cloud: downtrend regime confirmed.
- Price inside the cloud: consolidation / range — most signals here are noise.
This single check is more reliable than any individual line cross.
2. Cloud color
- Green cloud (Senkou A above Senkou B): future bias bullish.
- Red cloud (Senkou A below Senkou B): future bias bearish.
The cloud color leads price — it can flip while price is still trading inside, signalling that the regime is about to change.
3. Tenkan/Kijun cross
The Tenkan-sen (9-bar) crossing the Kijun-sen (26-bar) is analogous to a moving-average cross. It is most reliable when:
- Both lines are above the cloud (in an uptrend) for a bullish Tenkan/Kijun cross
- Both lines are below the cloud (in a downtrend) for a bearish cross
- Cloud color confirms the direction
4. Chikou Span position
The Chikou Span is the current close plotted 26 bars behind. When Chikou is above the price action from 26 bars ago, it confirms current strength relative to recent history. When below, current weakness.
Many Ichimoku traders require all four signals to align before acting — this filter produces fewer signals but materially higher per-signal edge.
Cloud thickness as conviction
The cloud's thickness (vertical distance between Senkou A and Senkou B) measures how decisively price would have to move to flip the regime:
- Thick cloud: strong support (if price is above) or strong resistance (if below). Price needs significant momentum to break through.
- Thin cloud: weak support/resistance. Price can punch through with modest momentum.
- Cloud twist (Senkou A and B crossing): the regime is in transition; the next directional move is often the cleanest setup.
The cloud also signals timing: when price approaches the cloud edge, expect a reaction. Bouncing off the cloud edge in the trending direction confirms the trend; breaking through reverses it.
Four pitfalls retail readers fall into
-
Drawing conclusions from one line in isolation. Ichimoku is a system — its strength comes from multi-signal confirmation. Using just the Tenkan/Kijun cross without checking price vs cloud and Chikou position drops the signal quality back to ordinary moving-average territory.
-
Trading inside the cloud. The cloud represents consolidation; signals inside are noisy and low-edge. Wait for price to break out of the cloud (above or below) before acting on Ichimoku signals.
-
Mis-applying to range-bound markets. Ichimoku is built for trend identification. In sideways markets (ADX below 20), the cloud flattens and the lines crisscross constantly without producing real signals. Combine with ADX as a regime filter.
-
Changing the default parameters. The 9/26/52 defaults derive from historical Japanese conventions and have been validated across decades and markets. Re-optimizing the parameters on a single instrument almost always overfits — the optimized values look great in backtest and break in forward testing. Stick to the defaults.
How Ichimoku behaves across markets
| Market | Ichimoku adoption | Notes |
|---|---|---|
| Japan | Very high — default system in retail and institutional desks | Originated here; cultural coordination is the strongest signal-amplifier |
| HK | Moderate — used in conjunction with western indicators | Multi-market platforms support it |
| A-shares | Low — A-share retail culture is centred on KDJ and MA stack | Ichimoku signals less self-fulfilling than in Japan |
| US | Niche — primarily used by FX and crypto traders who learned from Japanese sources | Less embedded in equity convention |
For multi-market portfolios, Ichimoku is most reliable on Japanese equities, currency pairs, and crypto — where the cultural coordination of "everyone watching the cloud" provides the same self-fulfilling boost that the 200-day MA has on US equities.
How Ichimoku fits in a multi-signal workflow
Ichimoku covers multiple layers in one indicator:
| Layer | Ichimoku component | External backup |
|---|---|---|
| Trend | Price vs Cloud, Cloud color | MA stack, ADX |
| Momentum | Tenkan/Kijun cross | MACD, RSI |
| Confirmation | Chikou position | Volume, capital flow |
| Support/Resistance | Cloud edges + Kijun-sen | Support/resistance levels |
Even users who run separate Western indicators alongside Ichimoku gain from the system's structural discipline — requiring four aligned signals filters out a substantial share of false positives that single-indicator workflows act on.
See Ichimoku on your portfolio. Use /chat to ask "render the Ichimoku cloud on each of my Japanese holdings and tell me which are trading above the cloud with green cloud color and rising Tenkan/Kijun." PickSkill computes the system on the latest prices and surfaces the multi-signal alignment.
Common follow-up prompts
- "For [ticker], show the current Ichimoku configuration. Where is price relative to cloud, Tenkan, Kijun, and Chikou?"
- "Find Japanese large-caps where all four Ichimoku signals align bullishly: price above cloud, green cloud, bullish T/K cross, and Chikou above 26-bars-prior price."
- "Compare Ichimoku signal frequency on Japanese equities vs US equities. Are signals more reliable in JP markets?"
- "Backtest the four-signal-alignment rule on the Nikkei 225 components over the last 10 years."
Further reading
- Investopedia on Ichimoku — comprehensive reference.
- Manesh Patel, Trading with Ichimoku Clouds — the most-cited English-language Ichimoku treatment.
- Hidenobu Sasaki's original work on Ichimoku — the original Japanese-language treatment from the 1960s.
FAQ
Why does Ichimoku look so complicated? Five lines plus a shaded cloud is a lot of information for one chart. The complexity is intentional — Ichimoku tries to answer "is there a trend, how strong is it, and where are key levels" all at once. Most traders find it overwhelming for the first month and natural-feeling after that. Start by hiding all lines except the cloud and Tenkan/Kijun, learn those, then add the Chikou Span.
Should I use Ichimoku on US stocks? You can — the math works identically on any liquid market. The signals will be statistically valid but less culturally self-fulfilling than on Japanese equities, where Ichimoku is the dominant retail and institutional convention. For US large-caps, RSI/MACD/MA stack have stronger cultural coordination.
Are the default parameters (9, 26, 52) optimal? They are tied to historical Japanese trading-day counts (when markets traded 6 days a week, 9 = roughly two weeks, 26 = one month, 52 = two months). They are not "optimal" in any modern statistical sense — but they are the convention. Re-optimization on a single instrument almost always overfits; stick to defaults unless you have strong out-of-sample evidence otherwise.
What is the difference between Senkou A and Senkou B? Senkou A is the faster of the two cloud boundaries (average of Tenkan and Kijun). Senkou B is the slower (52-bar midpoint). When Senkou A is above Senkou B, the cloud is green (bullish); when below, red (bearish). Both are plotted 26 bars ahead of the current price — making the cloud a leading visualization of future support/resistance.
Can I use Ichimoku on intraday charts? Yes — the system scales to any timeframe. On intraday charts, the 9/26/52 periods translate to roughly 9 hours / 1 day / 2 days at 60-minute bars, or 45 minutes / 2.2 hours / 4.3 hours at 5-minute bars. Most intraday Ichimoku traders use 1-hour or 4-hour bars; 5-minute Ichimoku has the same noise problems as any other 5-minute indicator.