What Are Bollinger Bands? Squeeze Before It Breaks
Bollinger Bands = 20-period SMA ± 2 stdev. Formula, what %B and bandwidth tell you, and why "the squeeze" beats simple band touches.
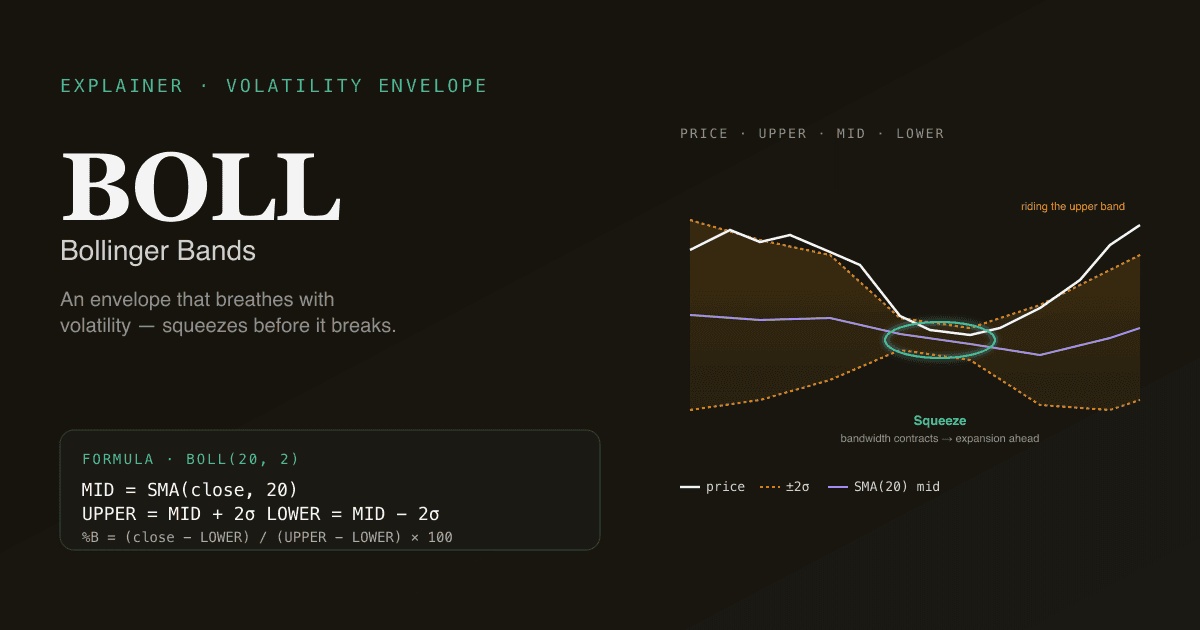
Bollinger Bands consist of a 20-period simple moving average (the middle band) plus and minus two standard deviations of the close (the upper and lower bands). They form an adaptive volatility envelope around price — wide when the market is volatile, narrow when it is quiet. Most retail guides oversell band breakouts as buy/sell triggers. The real value of Bollinger Bands is in two derived signals: %B (where price sits within the channel) and bandwidth (how compressed the channel is).
Key takeaways
- Three bands: middle = SMA(close, 20). Upper / lower = middle ± 2 × stdev(close, 20).
- %B =
(close − lower) / (upper − lower) × 100. 0 = at lower band, 50 = at middle, 100 = at upper.%B > 100means price has broken above the upper band;%B < 0means below the lower. - Bandwidth =
(upper − lower) / middle × 100. Low bandwidth = the market is coiled = a "squeeze." High bandwidth = the market is in expansion. - The squeeze is the highest-value signal. Tight, multi-week bandwidth contractions historically precede sharp directional moves — not necessarily up or down, but bigger than the recent norm.
- Renders across US, HK, and A-share daily bars in the PickSkill indicator dashboards with %B, bandwidth, and the 5-day bucket trail.
How are Bollinger Bands calculated?
Three simple steps applied bar-by-bar:
| Band | Formula |
|---|---|
| Middle | SMA(close, 20) |
| Upper | middle + 2 × stdev(close, 20) |
| Lower | middle − 2 × stdev(close, 20) |
The standard deviation is the population stdev across the same 20-bar window. The 20-period default with 2× multiplier is what John Bollinger published in the 1980s and remains the industry standard. Variants exist (10-period for faster signals, 50-period for slower, 1.5× or 2.5× multipliers for tighter or looser channels) but the defaults work for almost every daily-bar equity application.
Because the bands track recent volatility, they expand and contract dynamically. A stable trend produces wider bands than a sideways consolidation, even at the same price level — which is exactly why Bollinger Bands convey information that a fixed-percentage envelope cannot.
What does %B tell you?
%B = (close − lower) / (upper − lower) × 100
%B normalises position within the channel onto a 0–100 scale (with overshoots permitted):
| %B value | Reading |
|---|---|
| > 100 | Price has broken above the upper band |
| 80–100 | Riding the upper band — strong upward pressure |
| 50 | Exactly at the middle band |
| 20–0 | Riding the lower band — strong downward pressure |
| < 0 | Price has broken below the lower band |
%B is more useful than the raw "did price touch the band?" question because it's continuous and scale-independent. A reading of 95 on AAPL and 95 on a Chinese small-cap mean the same thing structurally — the close is high in its own 20-day volatility envelope. That cross-asset comparability is rare in technical indicators.
What is "the squeeze" and why does it matter?
Bollinger's most-cited contribution to technical analysis is the squeeze: when bandwidth contracts to a multi-month low, price is coiling. Statistically, the bands have just told you that the recent 20 days have been quieter than the normal regime for this asset. The historical pattern: quiet periods are followed by louder ones, often with a directional bias inherited from the move that exits the squeeze.
Three things are important about the squeeze:
- It is not directional. A squeeze does not tell you whether the breakout will be up or down. It tells you a breakout is more likely than not.
- It is more reliable on liquid mid-caps and large-caps. Micro-caps and illiquid stocks can squeeze for trivial reasons (no one is trading) without any meaningful coiling dynamic.
- You confirm the squeeze breakout, you don't anticipate it. Once bandwidth starts expanding with a directional move (price breaking above the upper band on a wide-range candle, or below the lower), the squeeze is resolving. That is the action moment — not the squeeze itself.
The bandwidth metric on the PickSkill indicator dashboards flags squeeze conditions when the current bandwidth sits in the bottom decile of its 6-month history.
When does price "ride the band"?
This is the trade-off that ruins most beginner Bollinger users: in strong trends, price hugs the upper band (or lower) for days or weeks. A retail trader who learned "touching the upper band is a sell signal" gets shaken out of every good trend.
The correct reading: when price closes outside the band on the same direction as the trend, and continues to close near or outside the band on subsequent days, the trend is intact and the band is acting as dynamic support (lower band in downtrend) or resistance (upper band in uptrend). Selling because the upper band was touched is the wrong move in this regime.
The reversal regime — where touching the band actually does signal exhaustion — typically also features:
- Declining momentum on a separate indicator (MACD histogram shrinking, RSI divergence)
- Volume not confirming the price extension
- Price unable to close meaningfully outside the band, repeatedly poking at it and reversing
So "price at band" is information, not instruction. The context determines whether the touch is continuation or reversal.
Three Bollinger pitfalls
- Trading every band touch as a reversal. Already covered above — the single most expensive Bollinger mistake retail traders make.
- Ignoring bandwidth. Treating Bollinger Bands like a static envelope and ignoring whether they are expanding or contracting throws away most of the indicator's information. A band touch during expansion means something different than a band touch during contraction.
- Using only the 2σ default without context. Two standard deviations means roughly 95% of recent closes should be within the bands, by definition. If you see price consistently outside the bands over weeks, the underlying isn't behaving normally — likely a regime shift (a takeover bid, a structural news event, a deleveraging cascade). Treat that as the signal, not as a Bollinger fault.
How do Bollinger Bands work on Chinese A-shares?
The formula is unchanged. Two structural notes:
- Limit-up streaks compress the standard deviation artificially. A stock that hits limit-up four days in a row registers very small day-over-day close changes (the close jumps to the limit price daily but doesn't move beyond). Stdev shrinks, the bands tighten, and the next non-limit day may register as an enormous "outside the band" event when in fact it's the first free-trading day. Read the bandwidth in context.
- Limit-down streaks have the symmetric effect. The PickSkill 5-day signal trail marks limit-up and limit-down days as neutral so the bucket doesn't read a structurally-compressed squeeze as a real one.
For Chinese mid-cap stocks (CSI 500 and below) where limit moves are routine, prefer interpreting Bollinger Bands on the parent index — limits don't apply there — and use the individual stock's bandwidth only as a sanity check.
See it on your portfolio. The /indicators page renders Bollinger Bands across every holding with the upper/middle/lower bands, %B, bandwidth, and a 5-day bucket trail.
How Bollinger Bands pair with other indicators
Bollinger Bands answer "where is price within its own volatility?" That question is position-aware, not trend-aware or momentum-aware. The natural pairings:
- ADX for the trend filter. In a trending regime (ADX > 25), trust upper-band rides and lower-band rides as continuation, not reversal. In a range-bound regime (ADX < 20), trust the band touches as mean-reversion candidates.
- RSI for momentum confirmation. A touch of the upper band with RSI already above 70 is more likely a reversal candidate; the same touch with RSI at 50 is more likely a healthy continuation.
- Volume to validate the breakout. A %B > 100 close on heavy volume is high-conviction. The same close on light volume is more likely a head-fake.
Further reading
- John Bollinger's Bollinger on Bollinger Bands (2001) — the indicator's developer explaining %B, bandwidth, and the squeeze in his own words.
- Bollinger Bands on Investopedia — modern reference with worked examples.
FAQ
Should I use the 20-period default? For daily-bar equity analysis, yes. The 20-period setting has held up across four decades of practitioner use and academic study. Shorter periods (10) generate more signals with more false positives. Longer periods (50) smooth out signal value. The PickSkill indicator dashboards use 20.
What is the difference between Bollinger Bands and Keltner Channels? Both are volatility envelopes. Bollinger Bands use standard deviation around an SMA; Keltner Channels use ATR (Average True Range) around an EMA. Keltner is smoother and slower; Bollinger is more responsive. Many traders watch both — a "TTM squeeze" indicator (popular in US trading communities) literally checks when Bollinger Bands sit inside Keltner Channels, an even tighter squeeze condition.
Why do Bollinger Bands sometimes look almost flat? Low bandwidth. The underlying has been quiet — small day-over-day price changes for an extended period. This is the squeeze condition. Statistically, low bandwidth resolves into expansion; the direction is determined by what catalyses the move, not by the bands themselves.
Can price stay outside the bands? Yes, in two regimes: (1) strong trends, where price rides the band; (2) regime-shifting events (takeover, capitulation, earnings shocks) where the move is genuinely outside the recent volatility distribution. Both are useful pieces of information — the indicator is telling you "what's happening now is not normal." Whether normal is a useful baseline depends on whether the underlying behaviour is regime-changing.
Is Bollinger Bands a leading or lagging indicator? Lagging. The middle band is a 20-period SMA — its inputs are all prior closes. The bands themselves are computed from prior stdev. Bollinger Bands tell you about the current statistical regime, not the next one. The squeeze is sometimes mistakenly called "predictive," but really it identifies a condition (low recent volatility) that historically precedes expansion — not the same as predicting the timing or direction of that expansion.