3-Indicator Filter: MACD + RSI + ADX, the Right Way
Stack indicators with discipline. ADX as regime filter, MACD as trigger, RSI as sanity check. Worked examples that filter false positives.
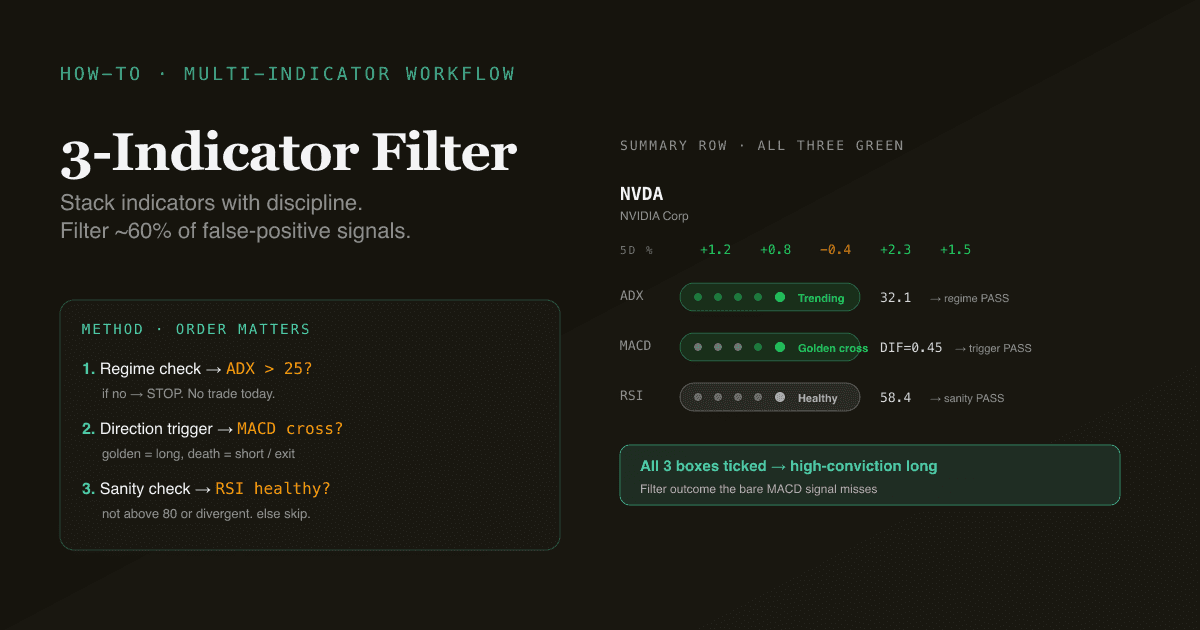
The most expensive retail technical-analysis mistake is stacking more indicators on the chart and treating each one as an independent signal. Eight overlapping indicators do not produce eight times the edge — they produce eight conflicting calls that statistically should agree most of the time anyway (because they all read from the same price series). This guide shows the disciplined 3-indicator workflow that pairs ADX (regime filter), MACD (trend trigger), and RSI (exhaustion check) — the combination that filters most false-positive signals without sacrificing real opportunities.
Key takeaways
- More indicators ≠ better signals. Most indicators are highly correlated because they all derive from price.
- Three roles, not three duplicate signals. ADX answers "is there a trend?" MACD answers "which direction?" RSI answers "is it overextended?"
- The order matters. Check ADX first (regime), then MACD (direction), then RSI (sanity). Skip any step and signal quality drops.
- A "go" signal requires all three to align. This is restrictive by design — it eliminates the bulk of false starts.
- The PickSkill summary view](/indicators) shows all three columns side-by-side with 5-day signal trails, so the check is a single scan, not a research session.
Why three indicators specifically?
The pragmatic answer: three is enough to cover the three orthogonal questions you need answered before acting on a technical signal, and not so many that you're staring at correlated information.
- Is the market trending at all? Trend-following systems whipsaw catastrophically in range-bound regimes. You need a non-directional indicator to answer this. ADX is the canonical choice.
- Which direction is the trend, and is momentum confirming? MACD answers this through the DIF/DEA cross and HIST inflections.
- Has price already extended past a reasonable extreme? RSI catches this — even when MACD says "still bullish," RSI above 80 is the indicator screaming caution.
Each indicator answers a question the other two do not. That's what makes the combination useful. Adding a fourth indicator that essentially restates one of the same three (say, Stochastic on top of RSI) gives you a louder version of the same signal, not new information.
The three steps, in order
Step 1 — ADX as regime filter
Check ADX first. The decision tree:
| ADX reading | Regime | Action |
|---|---|---|
| Above 25 | Trend exists | Proceed to step 2 (trust momentum signals) |
| Below 20 | No trend | Stop here — no MACD-based entries today |
| 20–25 | Trend forming or unclear | Take only the highest-conviction step 2 / 3 setups |
ADX < 20 means the market is range-bound. Any MACD cross in this regime has a poor track record and will whipsaw on average. The discipline to skip these days is what separates a 3-indicator strategy from a 1-indicator strategy that happens to use three indicators simultaneously.
Also check DI+ vs DI−. If ADX > 25 with DI+ > DI−, the trend is up — bullish setups get priority. If DI− > DI+, the trend is down — be cautious about long entries even if MACD is bullish; consider that "MACD golden cross in a down-trending market" as a low-conviction reversal candidate rather than a high-conviction long.
Step 2 — MACD as directional trigger
With ADX confirming the regime, look for MACD's directional signal in the trend's direction:
- Long setup: MACD golden cross (DIF crosses above DEA), ideally below the zero line (water-below = reversal context) or with HIST clearly expanding from the previous bar.
- Short or exit-long setup: MACD death cross (DIF crosses below DEA), ideally above the zero line (water-above = trend exhaustion at the top).
The water-above / water-below distinction matters here. See the MACD explainer for the full context. In summary: golden cross below zero = reversal candidate (high upside potential); golden cross above zero = continuation (lower upside but higher confirmation rate).
If MACD's signal contradicts ADX/DMI direction (golden cross when DI− > DI+), treat it as a counter-trend candidate — needs much stricter step 3 confirmation.
Step 3 — RSI as exhaustion check
Even when ADX and MACD agree, RSI provides a final sanity check. The rule:
| RSI reading | Long entry | Short entry |
|---|---|---|
| Below 30 | Strong support — entering on oversold | (counter-trend) |
| 30–50 | Healthy — momentum recovering | (counter-trend) |
| 50–70 | Healthy — momentum supporting | Caution — momentum still strong |
| Above 80 | Caution — price already extended | Strong support |
For a long entry, RSI between 30 and 65 is the most comfortable range. Above 70 means you're chasing — not necessarily wrong, but the asymmetric reward shrinks. Above 80 means a high probability of pulling back before continuing higher.
Also check for RSI divergence. A bullish setup with the entry confirmed by ADX + MACD + healthy RSI but accompanied by bearish RSI divergence (price up, RSI down) is a meaningfully weaker setup than the same trio without divergence.
A worked example
Let's walk a real signal through the filter. (Setup is illustrative — apply to your own positions on the /indicators page.)
A US large-cap, daily bars:
- ADX = 32, DI+ = 28, DI− = 15 → Strong uptrend, direction up. Step 1 pass.
- MACD: DIF just crossed above DEA at +0.45, both above zero, HIST = 0.08 and expanding → Bullish trigger in a trend-confirmed market. Water-above continuation, not reversal. Step 2 pass.
- RSI(14) = 58, no divergence → Healthy, momentum supporting, plenty of room before overbought. Step 3 pass.
All three boxes ticked. This is a high-conviction long setup. The next question — position size, stop placement, profit target — is outside the indicator workflow; the trio's job is to identify the setup, not the trade management.
Contrast with a signal that fails the filter:
- ADX = 15 → Range-bound. Step 1 fails — stop.
Or another:
- ADX = 28, DI+ > DI− → Strong uptrend. Pass.
- MACD golden cross above zero → Bullish trigger. Pass.
- RSI = 84, bearish divergence visible on the chart → Already overextended, with divergence warning. Step 3 fails — skip.
These look like setups; the filter exposes them as not actionable. That filter discipline is the workflow's real edge.
What about volume and capital flow?
In the 3-indicator filter, ADX/MACD/RSI carry the technical-analysis weight. Volume and capital flow are confirmation — not gating signals.
The pragmatic version:
- A 3-indicator pass with confirming volume (rising on the day of the MACD cross) is higher-conviction.
- A 3-indicator pass with declining volume is a yellow flag — the setup may be technically valid but lacks participation.
- Capital flow (real for HK / A-share, synthetic proxy for US in the PickSkill dashboard) is corroborative when positive on a long setup, suspicious when negative.
Volume and flow don't block the trade — they nudge position sizing. The setup either passes the 3-indicator filter or doesn't; volume just sharpens conviction.
How this works in the PickSkill summary view
The summary tab renders ADX, MACD, RSI side-by-side as adjacent columns with 5-day signal trails. A row where ADX is bullish for 5 days, MACD just turned bullish on day 4, and RSI is in the 40–60 healthy zone is visibly different from a row where any one of those three is off.
Scanning the table:
- All three columns green for 5 days: stable high-conviction long setup (in established positions, hold; in pre-positions, the setup has been valid for days — possibly past prime).
- ADX green + MACD just turned green + RSI healthy: the freshest setup pattern. Maximum interest.
- ADX flickering or bearish: ignore MACD and RSI for actionable signals; consult fundamentals if the underlying thesis still holds.
This is the workflow the trail was designed to make scannable: not "which indicator says what today," but "which indicators agree, for how long, and is anything just turning."
What the filter doesn't do
- It doesn't pick stocks. It tells you when an existing watchlist name is at a technical inflection. Stock selection is a fundamental-research problem.
- It doesn't size positions. The filter says "yes" or "no" on the setup. Position sizing depends on portfolio risk parameters that have nothing to do with technical analysis.
- It doesn't set stops or targets. Once you act on a pass-the-filter setup, trade management is its own discipline. Stops typically below the most recent swing low (for long entries) or above the recent swing high (for shorts) — but that's a trade-management decision, not an indicator decision.
- It doesn't work intraday. The filter runs on daily bars. Intraday technical filters use different indicators and different thresholds.
Try it now. Open the /indicators summary view for one of your portfolios and look at the ADX, MACD, and RSI columns side-by-side. Find a name where all three columns just turned green over the last 2 days — that's the 3-indicator filter resolving to "pass" in real time.
Further reading
- Murphy, Technical Analysis of the Financial Markets (1999) — chapter 9 covers multi-indicator confirmation in trend-following systems.
- Investopedia on indicator combinations — accessible overview of the trend-filter + momentum-trigger pattern.
FAQ
Why three indicators specifically and not four or five? Three is enough to cover the three orthogonal questions (regime, direction, extension) without overlap. Adding a fourth typically duplicates one of the existing three (Stochastic ≈ RSI; OBV ≈ Volume). More indicators raise the false-confidence problem: stacking correlated signals feels like more evidence but doesn't add information. The Combining MACD and KDJ in A-share workflows is a regional variant of the same logic.
Can I substitute KDJ for RSI in this framework? Yes — KDJ plays the same exhaustion-check role as RSI. The thresholds shift (KDJ uses 20/80 instead of RSI's 30/70), and KDJ's J line provides an additional amplifier. A-share-focused traders typically prefer KDJ; US-focused traders typically prefer RSI. The PickSkill dashboards ship both; pick whichever matches your market.
What about Bollinger Bands? Where do they fit? Bollinger Bands answer a different question — "where is price relative to its own volatility envelope?" — than the trend/direction/extension trio. They are useful as a position-sizing input (close to the bands = tighter stops) but redundant as a signal-generation tool when you already have RSI for extension. Bollinger squeezes (low bandwidth) are a separate, complementary signal for when a directional move is likely; the trio is for what the move is.
Does the filter work on crypto? Yes, with caveats. ADX, MACD, and RSI all compute on crypto daily bars. The thresholds may need adjustment — crypto trends harder and longer, so RSI thresholds at 80/20 (instead of 70/30) are common. ADX 25 still works as a trend filter. The 3-step logic is identical.
Where do I see the three indicators side-by-side? The summary tab on the /indicators page renders the ADX, MACD, and RSI columns with 5-day signal trails, letting you scan the filter pass/fail status across an entire portfolio in seconds.