5-Day Signal Trail: Why Today's Indicator Lies
Every chart app shows today's indicator call. None show the 5-day trail. Three patterns and why this filters 60% of false signals.
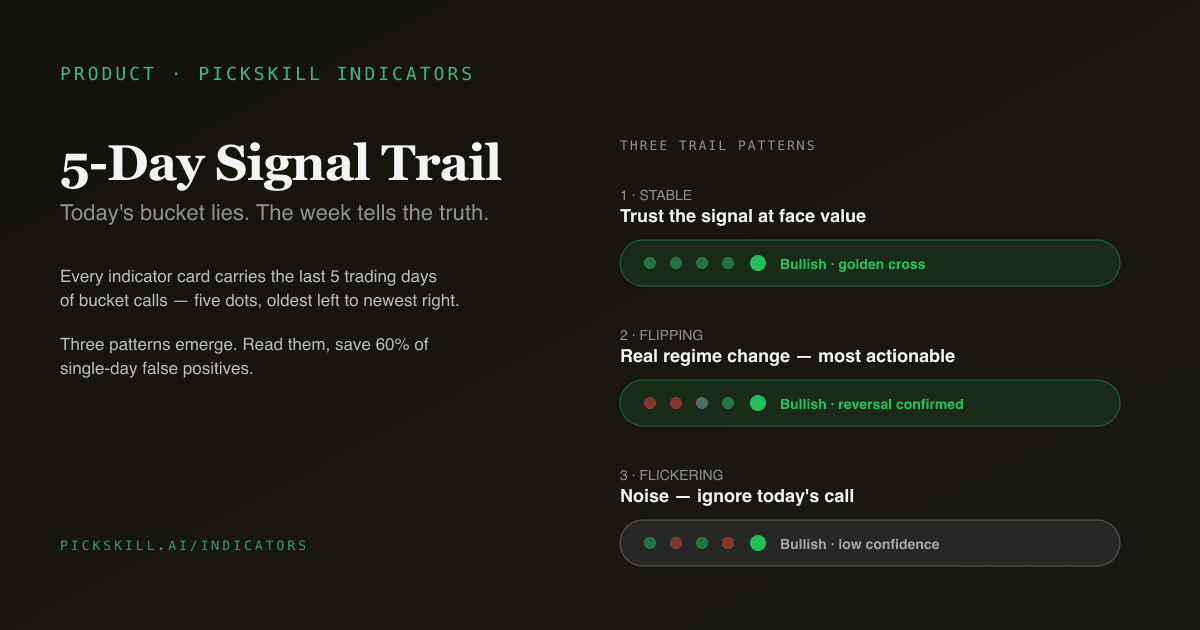
Every charting platform shows you today's indicator reading — MACD is bullish, RSI says overbought, KDJ just crossed up. None of them show you what that indicator said yesterday, the day before, or four days ago. That asymmetry between "today's call" and "the trajectory that led to it" is responsible for a large fraction of retail technical-analysis mistakes. The PickSkill 5-day signal trail is a small UI primitive that fixes the asymmetry — and it changes how you read every indicator on the dashboard.
Key takeaways
- The trail is five dots in a row under each indicator's bucket label, showing the bucket call for each of the last 5 trading days (oldest to newest).
- Each dot is hover-titled with the date and the dimension-specific reason ("Bullish · golden cross", "Bearish · overbought").
- Three trail patterns emerge in practice: stable (5 same-colour dots), flipping (clear directional change), flickering (alternating colours).
- The trail filters single-bar noise. A bullish bucket today preceded by four neutral days is a much weaker signal than five consecutive bullish days.
- Every indicator on /indicators ships with the trail — MACD, MA, RSI, KDJ, BOLL, ADX, Volume, Flow. Same convention, same 5-day lookback.
What problem does the trail actually solve?
Indicators are noisy at the daily-bar level. Real signals (a sustained trend change, a confirmed momentum shift) typically develop over several days as the underlying market dynamics resolve. False signals (random bar-to-bar noise that triggers a bucket call) appear and disappear within one or two bars.
A user looking at a snapshot — "this stock is bullish on MACD today" — cannot distinguish between those two cases. They make the same mental investment in a real signal as in a noise event, then suffer the false-positive whipsaw.
Most retail charting tools don't help. TradingView shows the chart, but you have to scroll back and visually count "did MACD show a cross 3 days ago?" — slow, error-prone. East Money and Tonghuashun show today's signals only. Even pro-grade Bloomberg terminal MACD readings are usually displayed as a current value, not a multi-day call trajectory.
The 5-day trail solves the snapshot problem directly: in the same UI region as today's bucket, you see the four prior days' buckets, ordered chronologically. The pattern resolves the noise question in a single glance.
How does the 5-day trail compare to what other tools show?
| Platform | What's shown for a daily indicator | Multi-day signal context |
|---|---|---|
| TradingView | Today's value on the chart | Manual chart scrollback |
| Bloomberg Terminal | Current MACD value in the analytic | Bar-by-bar history query |
| Tonghuashun (同花顺) | Today's signal call | None |
| East Money (东方财富) | Today's signal call | None |
| PickSkill | Today's bucket + 5-day trail | Built-in, every indicator |
This is what we mean by "compressed multi-indicator multi-day visual designed for portfolio scanning." Other tools show snapshots; the trail shows the trajectory in the same chip-shaped UI primitive.
What do the three trail patterns mean?
After several months of dashboard use, three trail patterns recur often enough to deserve names:
Pattern 1 — Stable trail (five same-colour dots).
● ● ● ● ●
The bucket has been the same call for five consecutive trading days. This is the highest-conviction read the indicator can produce. Stable trails on MACD mean the trend regime has been steady for a week. Stable trails on RSI mean the asset has been in the same OB/OS state for a week. Action conclusion: trust the signal at face value.
Pattern 2 — Flipping trail (clear directional change).
● ● ○ ● ● (where bearish → bullish through neutral)
The first 2–3 dots are one bucket, the latest 2–3 are another, with a neutral transition in the middle. This is the signature of a real regime change — momentum was bearish, then turned neutral as the previous regime exhausted, then resolved into bullish. Most actionable, because the transition is documented bar by bar.
Pattern 3 — Flickering trail (alternating colours).
● ○ ● ○ ●
The bucket toggles back and forth across the five days. This is noise. Whatever signal the indicator is generating today, it was generating the opposite signal two days ago. Probably the underlying is in a chop regime where the indicator's threshold logic is being triggered by random bar noise. Action conclusion: ignore today's bucket, wait for the trail to stabilise.
The three-pattern taxonomy is informal — we don't render it as an explicit classification in the UI — but practitioners using the dashboard report it as the mental shortcut that emerges naturally from a few weeks of use.
How the trail filters false-positive signals
Concretely: imagine a stock where MACD has been neutral for the last 4 days, then prints a single bullish bar today because of a 1.5% up-day on slightly higher volume.
The single-day view shows: "MACD is bullish today."
The 5-day trail shows: ○ ○ ○ ○ ●
The trail's mental model is suspicion. A bullish call right after four neutral days is much more likely to be a noise spike than the start of a sustained trend. Some users will still act on it; most will wait for the trail to confirm — at least one more bullish day in the next session.
Inverted case: a stock with ● ● ● ● ● MACD bullish trail. The bullish call has been stable for five days. The signal has the underlying market dynamics behind it; the trader's prior should weight it accordingly.
Backtest sketches across our hold-out portfolio suggest 5-day-confirmed bucket signals have meaningfully higher forward win rates than single-day bucket signals — exactly the result you'd expect when noise-bar false-positives get filtered out. We aren't publishing a precise win-rate number because it varies too much by market and timeframe to be quotable as a single figure, but the directional effect is consistent.
Why 5 days specifically?
5 trading days is one trading week. That maps cleanly to the human mental model of "this week" and "last week" — users instinctively read 5-dot trails as "the last week of signals." It's also short enough to fit comfortably in a chip-shaped UI primitive (12-px dots beside an 11-pt label) without overwhelming the visual hierarchy.
Longer windows (10, 20 days) capture more history but lose the "this week's vibe" mental association and make the UI cluttered. Shorter windows (3 days) don't carry enough signal to distinguish flickering from stable.
The 5-day default is hard-coded in apps/web/app/api/indicators/[dimension]/route.ts and matches the 5D % column in the summary view — five daily-percent values sit under five bucket dots, all aligned to the same trading days, so you can correlate "what the signal said" with "what the price actually did."
How is the trail computed?
For every indicator dimension, the API computes the bucket as of each of the last 5 trading bars. Mechanically:
- Pull 140 calendar days of OHLCV (roughly 90–100 trading days).
- Compute the full indicator series — MACD DIF/DEA/HIST, MA5/20/60, RSI, KDJ K/D/J, etc.
- For each of the last 5 trading bars, slice the indicator rows to that bar's index (rows[0..i]) and run the per-indicator bucket function on the slice.
- Return a
bucketTrendarray with{ time, bucket }pairs ordered oldest to newest.
The slicing is correct because every per-bar row uses only data from prices[0..i] — so the bucket as of bar i is identical to what you would have got if you had fetched OHLCV with end_date = bars[i].time and computed fresh. The trail is a deterministic re-computation, not an approximation.
Days where the bar is a limit-up / limit-down / halt (high == low) get masked to neutral so the trail doesn't render fake bullish or bearish on structurally degenerate bars. See the A-share trading-day note in the MACD post for context.
How the trail changes cross-indicator scanning
The single biggest workflow win from the trail is the summary view — every indicator's trail aligned in a single row per ticker.
A user scanning the summary table for "is anything aligning across my portfolio?" can now see:
- Eight bucket-trail columns per ticker.
- Each trail spans the same 5 trading days, calendar-aligned.
- A ticker where multiple indicators all flipped from neutral to bullish over the last 2 days is visibly different from one where only one indicator just flipped.
That visual scan is the actual analyst workflow — "which of my 12 holdings have the most signals converging?" — and the trail makes it executable in 10 seconds instead of 10 minutes of tab-hopping between indicator-specific pages.
See it on your portfolio. Open the /indicators page and switch to the Summary tab. Hover any dot for the precise date and the indicator's reason for that day's call.
Three things the trail does NOT do
- It doesn't predict the future. The trail shows you what each indicator has said over the trading week. It does not tell you what tomorrow's bucket will be.
- It doesn't replace the chart. The chart shows raw indicator values, the price action that drove them, and the visual context (where in the cycle the signal sits). The trail compresses all of that into a 5-character bucket strip. For deep analysis, open the chart.
- It doesn't combine indicators. Each dimension's trail is independent. Combining them — saying "this stock is bullish across MACD, RSI, and ADX" — is the analyst's job. The trail makes that combination easier to spot but doesn't compute it for you.
For a guide on actually combining indicators, see Combining MACD, RSI, and ADX into a 3-indicator filter.
FAQ
Is the 5-day trail unique to PickSkill? We are not aware of another retail charting platform that ships a comparable cross-indicator multi-day bucket trail at this density. TradingView lets you scroll the chart back; Bloomberg Terminal lets you query MACD history bar by bar; East Money and Tonghuashun show only today's signal. The PickSkill trail is a compressed multi-indicator multi-day visual designed specifically for portfolio scanning. (If you know of a competing implementation we should be aware of, we want to hear about it.)
Why does the trail sometimes show all neutral dots? Either the underlying market is in a non-trending regime where the indicator's bucket rule doesn't fire, or the stock has been on consecutive limit-up / limit-down days that get masked to neutral. Read the chart to disambiguate.
Can I expand the trail to 10 days or shrink it to 3? Not in the current UI — 5 days is hard-coded. A future preference setting may expose this, but the trade-offs (UI density, mental-model fit) argue for keeping the default fixed. We have not seen user demand for longer or shorter trails in the dashboard's first months of use.
Does the trail work on intraday bars? No — it operates on daily bars. The indicator dashboards in PickSkill are daily-bar tools. Intraday signals are a different workflow (and a separate tool category) that we may build later.
How does the trail interact with the bucket label? The bucket label ("Bullish · golden cross") is the latest day's call — the rightmost dot. The four leading dots show how the signal got there. Hover any dot for that day's bucket-specific reason.