What Is RSI? The Oscillator That Lies in Strong Trends
RSI is a 14-period oscillator on a 0–100 scale. Formula, why 70/30 fail in trends, and the divergence patterns that actually predict reversal.
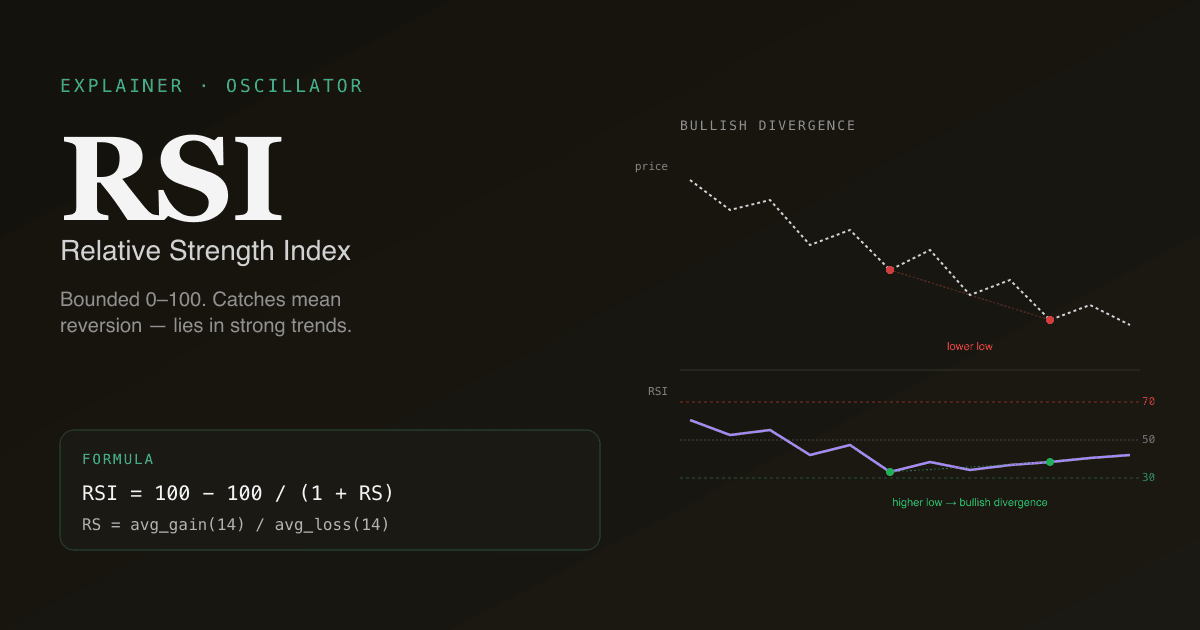
RSI (Relative Strength Index) is a 14-period oscillator that compares the magnitude of recent up-closes to recent down-closes, mapped onto a 0–100 scale. Above 70 traditionally signals "overbought" (likely to fall), below 30 signals "oversold" (likely to rebound). The trap that catches most retail traders: in strong trends, RSI can sit above 70 (or below 30) for weeks while price keeps moving in the same direction.
Key takeaways
- Bounded 0–100, centred at 50. The boundaries are mathematical certainties, not statistical thresholds.
- 70/30 are the classic Wilder thresholds. Some traders use 80/20 (stricter, fewer signals) or 60/40 (looser, more signals). All three are defensible.
- RSI is a mean-reversion indicator, not a trend indicator. It tells you when price has stretched far from its own recent average — useful in range-bound markets, dangerous in strong trends.
- Divergence is the highest-value RSI signal. Plain overbought / oversold readings have a poor track record on their own; bullish or bearish RSI divergence — price moves one direction, RSI moves the other — has documented predictive value.
- Renders across US, HK, and A-share daily bars in the PickSkill indicator dashboards, with bucket signals tied to the 70/30 thresholds.
How is RSI calculated?
The Wilder smoothing formula has three steps. On every bar, compute the price change since the previous bar. If positive, that bar is a "gain" of that amount; if negative, it is a "loss" of the absolute value. Otherwise both are zero.
The smoothed averages start as a simple 14-period mean of gains and losses respectively. From bar 15 onward, RSI uses Wilder's exponential smoothing:
| Step | Formula |
|---|---|
| Average Gain (Wilder) | avg_gain = (prev_avg_gain × 13 + new_gain) / 14 |
| Average Loss (Wilder) | avg_loss = (prev_avg_loss × 13 + new_loss) / 14 |
| RS | RS = avg_gain / avg_loss |
| RSI | RSI = 100 − 100 / (1 + RS) |
When losses are zero (uninterrupted up-streak), RS is infinite and RSI is exactly 100. When gains are zero, RSI is exactly 0. Both extremes are extraordinarily rare on real instruments at the 14-day scale — meaning typical readings live in a narrower 20–80 band even on volatile stocks.
What do the 70 and 30 thresholds actually mean?
The conventional reading is mean-reversion: above 70, the stock has gained more aggressively than its recent average, and may be due for a pullback. Below 30, it has lost more aggressively than average, and may be due for a bounce. The thresholds are arbitrary — Wilder chose 70/30 by inspection in the 1970s, not from a statistical optimisation — but they have become canonical because they roughly correspond to one-standard-deviation moves on most equities.
The honest characterisation: 70 and 30 are attention markers, not action signals. They tell you the price has stretched. Whether it will revert depends on whether the market is in a regime where mean reversion is the dominant dynamic — which it often is not.
Why does RSI fail in strong trends?
This is the single most-misunderstood property of the indicator. Consider a stock in a clean uptrend that gains 2% per day for two weeks. Every day is a "gain" day; "loss" days are rare and small. The avg_gain is large and growing; avg_loss is tiny. RSI saturates near 100 and stays there.
A retail trader who learned "RSI above 70 means sell" sees a 75 reading on day three, exits, and watches the stock add another 20% over the next ten sessions. The mistake is treating RSI as a leading indicator in a regime where it is, in fact, confirming the trend.
Three things repair the failure mode:
- Use higher thresholds in trending regimes. On strong-trend stocks, treat 80/20 (or even 85/15) as the action thresholds instead of 70/30.
- Pair RSI with a trend filter. ADX above 25 means the trend is real; in that regime, ignore mean-reversion signals from RSI and look for momentum continuation instead. ADX below 20 means range-bound; in that regime, RSI's mean-reversion signals work.
- Focus on divergence, not absolute level. RSI divergence is regime-neutral — it works whether the underlying is trending or ranging.
What is RSI divergence?
Divergence is when price and RSI disagree about direction.
- Bullish divergence: price makes a lower low; RSI makes a higher low. The asset is falling, but the strength of the falls is weakening. Often the earliest warning that a downtrend is exhausting.
- Bearish divergence: price makes a higher high; RSI makes a lower high. The asset is rising, but each rally is less aggressive than the last. Often the earliest warning that an uptrend is rolling over.
Divergence is RSI's highest-leverage signal. Academic and practitioner backtests consistently show divergence outperforms the bare 70/30 cross by a wide margin in terms of forward win rate, particularly on liquid mid-cap and large-cap equities.
The catch: divergence is also routinely false. A bearish divergence on a strong-trend stock can persist for two months while the stock keeps grinding higher. Use divergence as a candidate generator, not a trigger — confirm with a second signal (MACD cross, support break, ADX inflection) before acting.
How to read RSI on Chinese A-shares and HK stocks
The math is identical. Two adjustments are worth knowing:
- Daily price limits (A-share ±10% / ±20% / ±5%) create artificial RSI saturation during consecutive limit-up streaks. A stock that hits limit-up four days in a row will push RSI near 100 in a way that does not reflect a normal supply / demand exhaustion — it reflects a structural constraint. Reading "overbought" off that RSI value is meaningless.
- Halt fills (some A-share data sources fill halted-trading days with the prior close) inject zero-change days into the RSI calculation. Those days nudge RSI toward 50 over time. Multiday halts can produce misleading "RSI cooling off" readings during what is actually a pause in trading.
The PickSkill indicator dashboards flag limit-up / limit-down / halt bars and force the RSI bucket to neutral on those days, so a consecutive-limit run does not produce a false-positive oversold rebound signal.
See it on your portfolio. The /indicators page renders RSI(14) for every holding alongside the latest value, the OB/OS zone, and a 5-day signal trail.
RSI vs. other oscillators
| Indicator | Scale | Best for | Weakness |
|---|---|---|---|
| RSI(14) | 0–100 | Mean reversion in range-bound markets | Saturates in strong trends |
| KDJ(9,3,3) | K/D in 0–100; J unbounded | A-share short-term swings; cross signals | Whipsaws in choppy markets |
| Stochastic(14,3,3) | 0–100 | Slower mean reversion than KDJ | Same trend-failure mode as RSI |
| CCI(20) | Zero-centred, ±100 typical | Detecting extreme statistical deviations | Frequent false signals on noisy stocks |
For most retail workflows, RSI + a trend filter (ADX or MA) is sufficient. Adding KDJ gives you a second oscillator with different smoothing characteristics — useful in A-share contexts where KDJ is the cultural standard. See MACD vs RSI for the head-to-head comparison.
Further reading
- J. Welles Wilder's New Concepts in Technical Trading Systems (1978) — the original publication that introduced RSI alongside ADX, ATR, and Parabolic SAR.
- RSI on Investopedia — modern reference covering the 70/30 thresholds and divergence patterns.
FAQ
What is a good RSI reading to buy a stock? There is no single "good" reading. The honest answer: RSI by itself is a poor entry signal. Bullish setups generally require RSI to be either (a) recovering off an oversold extreme (≤30) with a confirming candle, or (b) showing bullish divergence with price. In strong uptrends, RSI staying above 50 is itself a bullish characteristic — buying RSI dips to 40 has worked better historically than waiting for the 30 threshold that may never come.
Why does RSI sometimes show 100 or 0? RSI hits 100 when there are no down-closes in the lookback window — a 14-bar uninterrupted up-streak (or near it). It hits 0 in the mirror case. Both are rare on liquid equities and almost always associated with structural events (squeeze, capitulation, limit-up/down on A-shares). On the PickSkill indicators page you will see this most often during catalyst-driven moves.
Should I use RSI on cryptocurrencies? RSI works on any asset class — the formula does not care about the underlying. That said, crypto trends harder than equity for longer, so RSI's failure mode in strong trends is more pronounced. The standard recommendation: use 80/20 thresholds on crypto, and lean harder on divergence than on absolute levels.
Is the 14-period default optimal? For daily-bar equity analysis, the 14-period Wilder default is the industry standard. Shorter periods (9, 7) make RSI more responsive but produce many more false signals. Longer periods (21, 28) smooth the indicator but lag the inflection. The PickSkill indicator dashboards use 14.
What is the difference between RSI and Stochastic RSI? Standard RSI is calculated from price. Stochastic RSI is calculated from RSI — it applies a stochastic oscillator formula to the RSI series, producing a hyper-responsive indicator that oscillates between 0 and 1 (or 0 and 100). Stochastic RSI generates more signals than RSI alone and is preferred by some short-term traders. The trade-off is more whipsaws and more false signals. For most retail workflows, plain RSI is enough.