How to Confirm a MACD Golden Cross: 5 False-Signal Filters
Confirm a MACD golden cross with 5 checks: zero line, histogram, weekly trend, volume and moving average, plus HK and A-share caveats and a screen prompt.
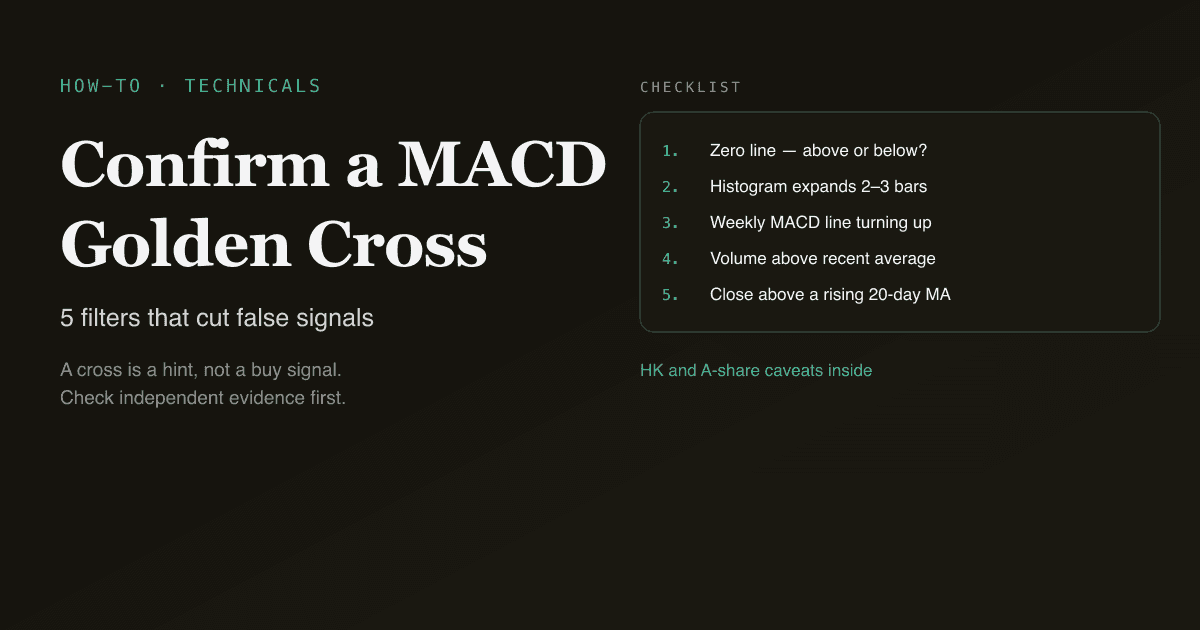
A MACD golden cross happens when the MACD line (the fast line) crosses up through the signal line (the slow line), a sign that short-term momentum is starting to outpace medium-term momentum. In Chinese charting software these two lines are labelled DIF and DEA. On its own, the cross only says the stock might be turning stronger: in a sideways market, daily golden and death crosses can flip back and forth several times within a week or two. So the useful question is not "has it crossed?" but "is this cross worth trusting?" This guide gives five conditions you can check one by one, plus what to watch for specifically in Hong Kong and A-share stocks.
Key takeaways
- A golden cross is a starting point, not a signal. A daily cross on its own produces plenty of false signals; check it against at least two or three independent conditions.
- Five confirmation checks: position relative to the zero line, whether the histogram expands over the next few days, whether the weekly chart agrees, whether volume picks up, and whether price is back above a medium-term moving average.
- The weekly chart is the most effective filter. A daily golden cross while the weekly MACD line is still falling is usually just a bounce inside a downtrend.
- Hong Kong and A-shares each have their own traps. In A-shares, T+1 settlement and daily price limits can leave you unable to act on a signal in time; in Hong Kong small caps, thin trading lets a handful of trades distort the indicator.
Why is a MACD golden cross so often a false signal?
Because MACD is calculated from moving averages of price, it lags by construction, and it is very sensitive to sideways action. When price chops around inside a range, the MACD line and the signal line keep winding around each other, and every crossing draws another golden or death cross. On the chart, these crossings look exactly like the cross that starts a real trend; the only difference is whether anything follows through afterwards.
So the approach to confirmation is this: when a golden cross appears, don't treat it as an entry yet. Check whether several other, independent dimensions are turning stronger at the same time. The more independent the dimension, the more the confirmation is worth. Volume and the weekly trend, for example, have little to do with how daily MACD is calculated, so cross-checking against them tells you more than adding yet another moving-average-based indicator.
What five conditions confirm a MACD golden cross?
Work through them in order. The more a cross satisfies, the more credible it is:
- Zero-line position: A golden cross above the zero line means the medium-term trend was already up, so this is a "pullback, then resume" setup with better odds of continuing. A cross below the zero line is a bounce within a decline; it comes earlier and fails more easily. Crosses below zero need more of the other conditions to line up.
- Whether the histogram keeps expanding: Over the 2 to 3 bars after the cross, the MACD histogram bars should get taller one after another. If the bars start shrinking right after the cross, momentum hasn't followed through, and a death cross often comes soon after.
- Weekly direction: Switch the same stock to the weekly chart and check whether the weekly MACD line is rising, or whether the weekly chart has just produced a golden cross too. A daily golden cross with the weekly trend pointing up is the most common form of "alignment" confirmation; a daily golden cross while the weekly is still falling is, more often than not, just a bounce.
- Volume: On the day of the cross or in the one or two days after, volume should be clearly above its recent average (a volume ratio above 1 is a simple threshold). A golden cross on shrinking volume means buyers haven't really stepped in.
- Price and the moving average: The close should be back above the 20-day moving average, ideally with the 20-day average itself starting to turn up. While price is still pinned below a falling moving average, the cross looks more like a pause in a downtrend.
A practical rule: for a golden cross below the zero line, only consider it if at least three conditions hold together: an expanding histogram, a rising weekly chart and higher volume. For a cross above the zero line, meeting any two of these is enough to put it on your watch list. This isn't a trading system; it's a filter that keeps you from mistaking sideways noise for a trend.
How do you use weekly MACD to confirm a daily golden cross?
Each bar on a weekly chart covers a full week of price, so weekly MACD moves slowly, but it is rarely thrown off by a day or two of volatility. When using it to confirm a daily signal, look at three things:
- The direction of the weekly MACD line: This matters more than whether the weekly chart has already crossed. A weekly MACD line that has turned up shows medium-term momentum improving, even before any weekly cross.
- Where the weekly chart sits: If the weekly is above the zero line and rising, the daily golden cross is with the trend; if the weekly is below the zero line and still falling, the daily cross is against it.
- The time lag: A weekly golden cross typically shows up several weeks after the daily one. Waiting for the weekly cross to confirm gives you a more reliable signal, but a later entry. You are trading price for certainty, so decide in advance which one you're willing to accept.
How is reading a MACD golden cross different in Hong Kong and A-shares?
The same indicator calls for different precautions in the two markets:
- A-shares: Under T+1 settlement, shares bought today can't be sold until the next trading day, so if the stock gaps down the day after a golden cross, you can't stop out the same day you bought. Daily price limits (10% on the main board, 20% on ChiNext and the STAR Market) freeze price on limit-up or limit-down days and distort the indicator along with it; a golden cross that follows a run of sessions locked at the limit carries very little information.
- Hong Kong: There are no price limits and no T+1, so signals can be acted on faster, but many small and mid caps trade thinly, and one or two large orders are enough to produce a golden cross. Apply a stricter volume condition to Hong Kong crosses, and ideally use them only on stocks with high average daily turnover.
- Both markets: Around earnings season, prices often gap on results. A golden cross created by a gap needs to be read alongside the fundamentals, not treated purely as a technical signal.
For more on how indicators behave differently across markets, see how MACD differs between A-shares and US stocks.
How do you find and check MACD golden crosses with PickSkill?
PickSkill's screener and per-stock signals are built on daily market data and cover US, Hong Kong and A-share stocks. You can turn the conditions above into a screen with a single sentence, for example:
Find Hong Kong stocks with a MACD golden cross in the last 3 trading days, rising volume and bullish moving-average signals
It returns the stocks that match, along with the data showing which conditions each one met. For any single stock, open its stock page (for example Tencent) to see signals across eight dimensions for the last 5 trading days: MACD, moving averages, RSI, KDJ, Bollinger Bands, ADX, volume and money flow.
One caveat: all of PickSkill's built-in signals are on the daily timeframe, so for the weekly confirmation step, switch to the weekly chart in the charting software you normally use. To go deeper on the cross itself, read what golden and death crosses are; to combine MACD with other indicators, see MACD vs RSI and the three-indicator filter.
FAQ
How long after a MACD golden cross should you wait to confirm it? Typically 2 to 3 trading days after the cross: check whether the histogram bars are growing one after another, whether volume is above its recent average, and whether price is holding above the 20-day moving average. Weekly confirmation takes longer, since a weekly golden cross usually appears several weeks after the daily one, but the signal is also more stable.
Can you buy on a MACD golden cross below the zero line? It's worth watching, but with more caution. Below the zero line, the medium-term trend is still weak, and the cross is more likely a bounce. You want to see at least three conditions at once (an expanding histogram, a rising weekly MACD line and higher volume) and then weigh the fundamentals; otherwise the failure rate is high.
What's the difference between a MACD golden cross and a moving-average golden cross? A moving-average golden cross is a short-term average crossing above a longer-term one (for example, the 5-day crossing above the 20-day), which reflects a change in the trend of price itself. A MACD golden cross is the MACD line crossing above the signal line, which reflects a change in momentum; it usually comes earlier than a moving-average cross but is also more prone to false signals. When both appear together, the confirmation is stronger.
Why do MACD golden crosses fail so often in Hong Kong stocks? Many Hong Kong small and mid caps trade very little volume, so a handful of trades can move both price and the indicator sharply, drawing golden crosses that don't reflect real buying. For Hong Kong crosses, stick to stocks with high turnover and treat rising volume as a required condition.
Can PickSkill show weekly MACD directly? Not at the moment. PickSkill's stock signals and screener are all calculated from daily data. For weekly confirmation, switch to the weekly chart in your charting software, then read it together with the daily signals PickSkill provides.