Does Gold Go Up in a Financial Crisis? 12 Crises
Gold often falls in the panic, bottoms before stocks and rallies once central banks print. Data from 12 crises since 1929, with dates and drawdowns.

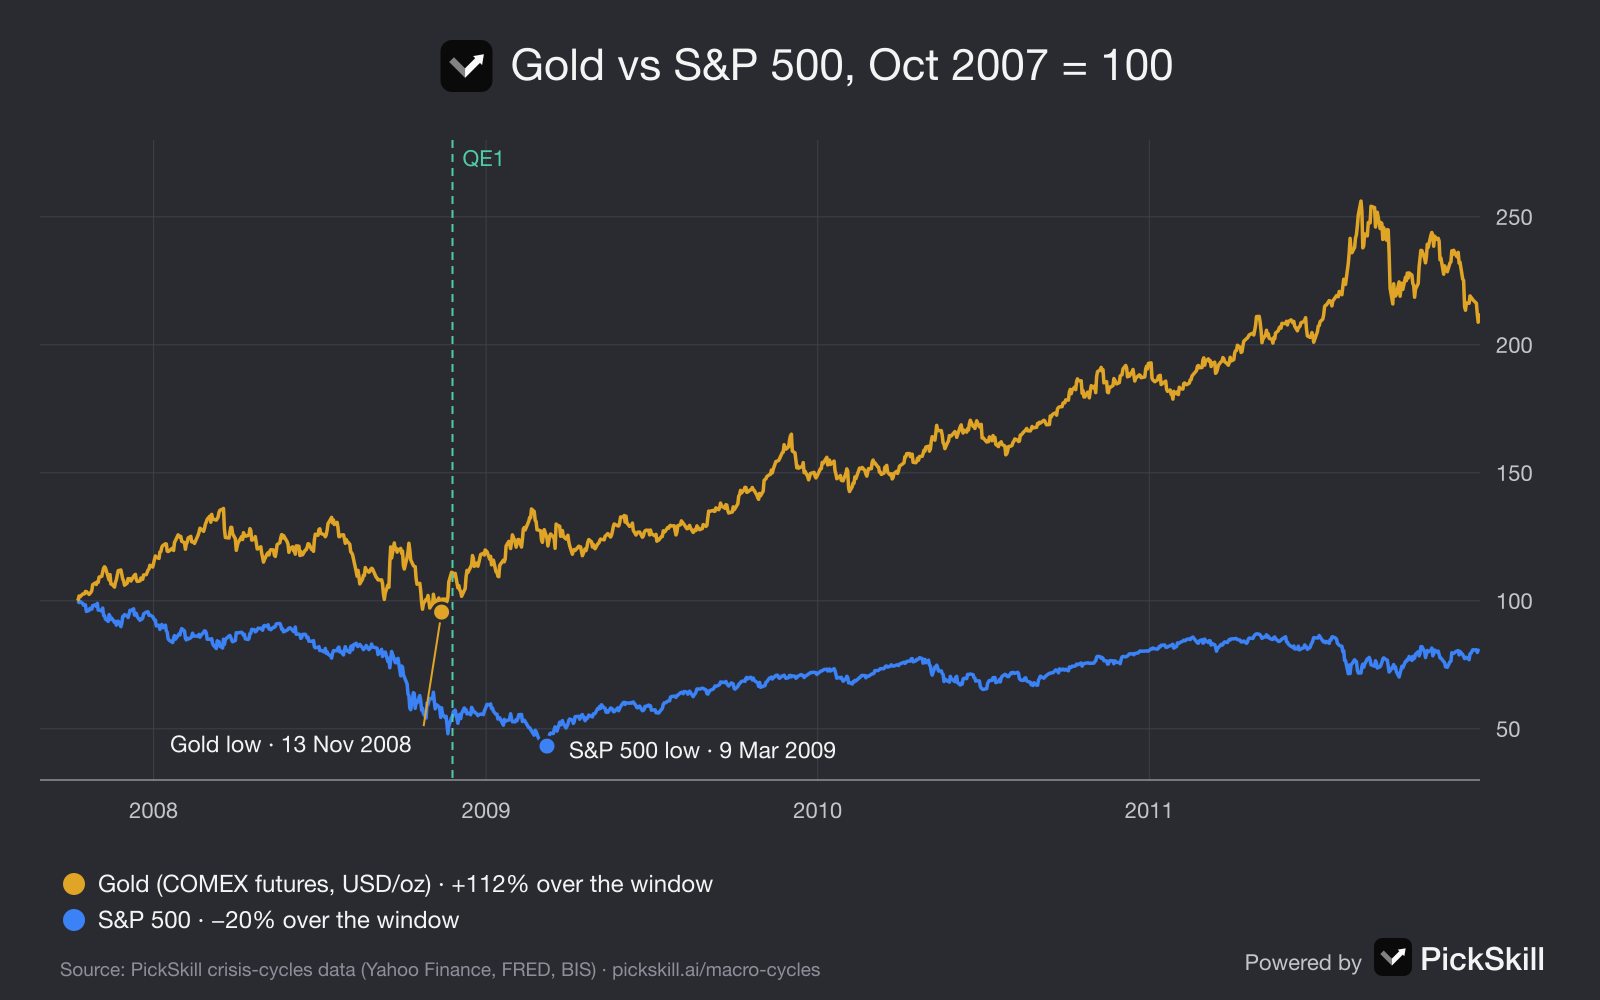
Gold usually does not go up at the start of a financial crisis. In the panic it is often sold along with stocks, because it is the easiest asset to turn into cash. It then tends to bottom before stocks and rally hard once central banks start printing money. In 2008 gold fell 29.7% from March to 13 November, bottomed 116 days before the S&P 500, then climbed 168% to August 2011. In March 2020 it lost 11.8% in nine days, bottomed five days before stocks and set a record by August. The exception is a crisis caused by rising rates: in 2022 gold kept falling after stocks had turned.
This article uses the same daily data as PickSkill's crisis cycles page, which tracks cash, gold, housing and stocks through every major crisis since 1929. Each section links to the exact place on that page where you can see the numbers yourself.
Key takeaways
- Gold falls first in most deflationary crises. Forced sellers need dollars, and gold is liquid and usually in profit.
- It bottoms before stocks. 116 days before the S&P 500 in 2008, 42 days before Chinese stocks in 2015–16, five days before the S&P 500 in 2020.
- Money printing is what turns it. The rally starts around quantitative easing, zero rates or a devaluation, not around the first rate cut.
- Rising real interest rates are gold's real enemy. It peaked in 1980 and 2011 when policy turned tight, and fell 20% in 2022.
- In your own currency the answer can differ. In Korea in 1997 or China in 2022–25, gold rose sharply in local terms even when the dollar price did not.
Why does gold fall at the start of a crisis?
Gold falls at the start of a crisis because the first phase is a scramble for cash, not a search for safety. When banks, funds and leveraged traders face margin calls, they sell what they can sell quickly and at a profit. Gold qualifies on both counts. At the same time the world rushes into US dollars, and a stronger dollar pushes the dollar price of gold down. In 2008 the dollar index rose 24.9% between April 2008 and March 2009; in March 2020 it rose 8.3% in eleven days. On PickSkill's page this phase is called the first half of the crisis, and its clearest symptom is stocks and gold falling together. That signal is not the start of a crisis. Historically it marked the climax of the panic, days to months from the low, which is the first of the six regularities the page draws from twelve crises.
When does gold bottom compared with stocks?
Gold has usually bottomed before the stock market, by anything from a few days to several months. The table below measures each episode on daily closes, using the local stock benchmark for each crisis.
| Crisis | Stock index, peak to trough | Gold fall before its low | Gold low | Gold low vs. stock low |
|---|---|---|---|---|
| 2008 Global Financial Crisis | S&P 500 −56.8% | −29.7% (Mar → Nov 2008) | 13 Nov 2008 | 116 days earlier |
| 2015–16 China crash | Shanghai −48.6% | −12.5% (Jun → Dec 2015) | 17 Dec 2015 | 42 days earlier |
| 2020 COVID crash | S&P 500 −33.9% | −11.8% (9 → 18 Mar 2020) | 18 Mar 2020 | 5 days earlier |
| 2000–02 dot-com bust | S&P 500 −49.1% | −10.8% (2000 → 2001) | Feb 2001 | ~20 months earlier |
| 2022 inflation shock | S&P 500 −25.4% | −20.2% (Mar → Nov 2022) | 3 Nov 2022 | 22 days later |
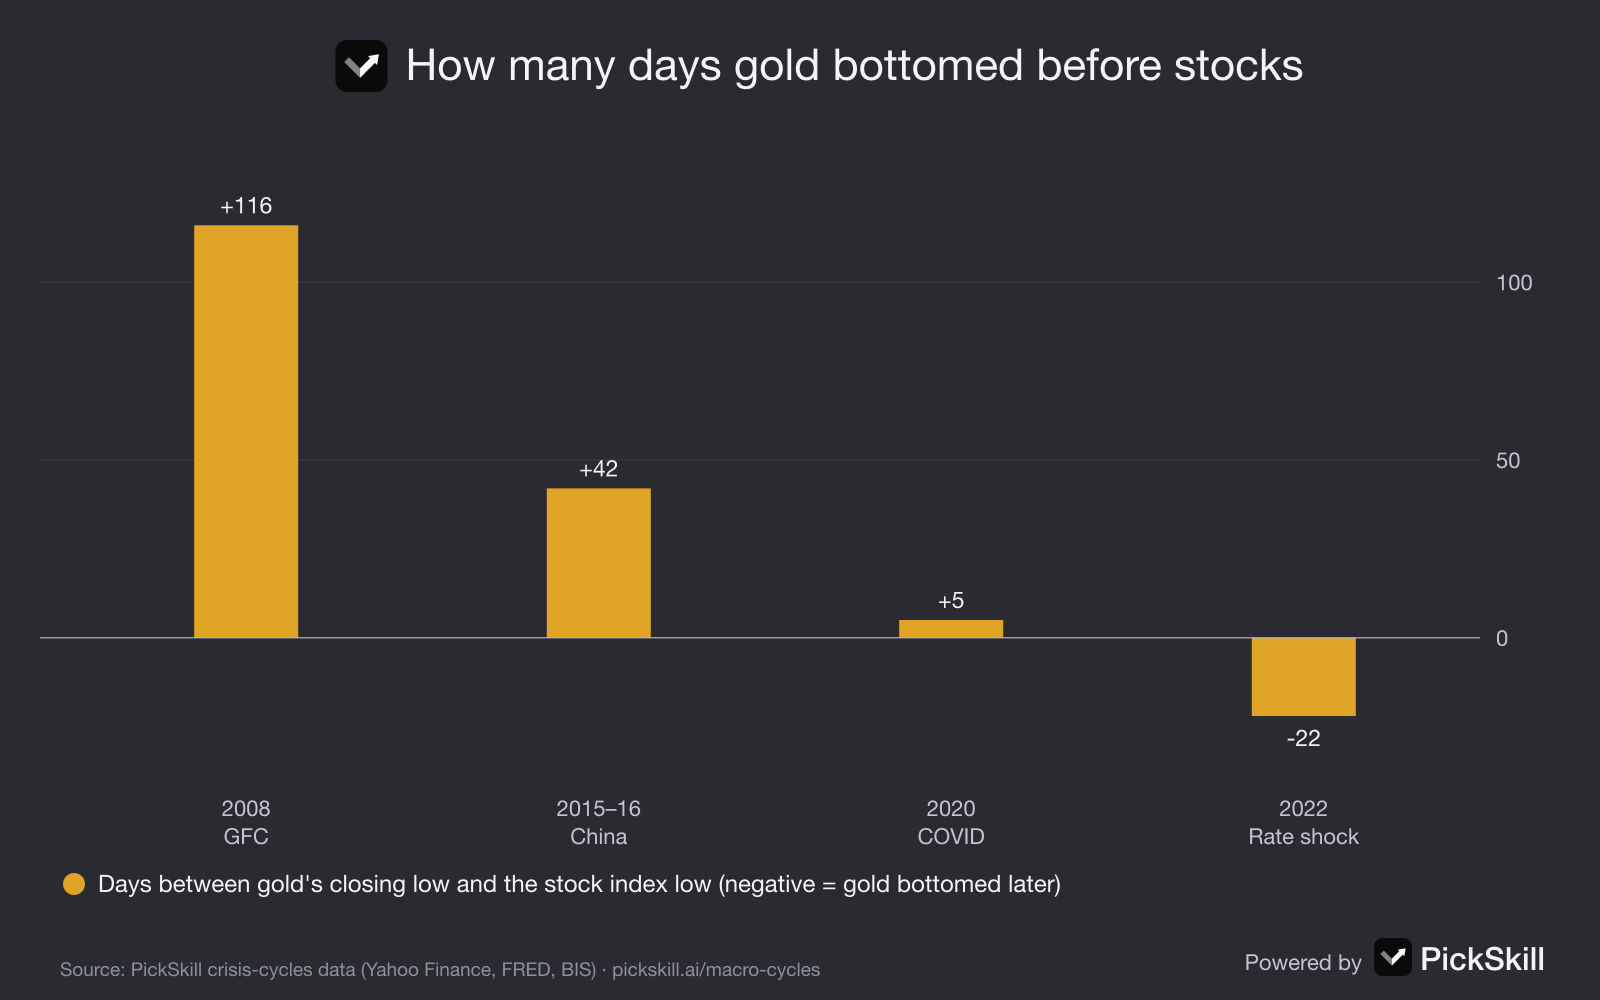
Source: PickSkill crisis-cycles data (COMEX gold futures and index closes via Yahoo Finance). To see the 2008 sequence on one chart, open the timeline zoomed to the Global Financial Crisis.
What turns gold back up?
Gold turns back up when central banks stop defending the currency and start supporting the system with unlimited money. In 2008 the Federal Reserve announced its first round of quantitative easing (QE1) on 25 November, twelve days after gold's low. In 2020 it cut rates to zero on 15 March and promised unlimited bond buying on 23 March, and gold had bottomed on 18 March. In 1933–34 the United States left the gold standard and revalued gold from $20.67 to $35 an ounce, a 69% rise by decree. PickSkill calls this moment the watershed, and the second regularity on the page is that the turning point is unlimited support, not the first rate cut. After the watershed gold has led the recovery: from November 2008 to August 2011 it rose 168%, more than the S&P 500 managed over the same period.
When does gold fall and stay down?
Gold falls and stays down when interest rates rise faster than inflation, because cash and bonds then pay a real return and gold pays nothing. This is the sixth regularity on the page: gold's enemy is rising real rates. The two great gold tops both came when policy turned credibly tight. In January 1980 Paul Volcker's rate hikes ended a decade in which gold had risen from $35 to $850, and the price then fell for twenty years. In September 2011 gold peaked at $1,921 at the height of the euro debt crisis; once the European Central Bank's "whatever it takes" pledge calmed markets and US real yields rose, gold lost about 45% by December 2015. In 2022, the fastest US rate hikes in forty years pushed gold down 20%, and record central-bank buying is what stopped it falling further.
Does gold protect you in your own currency?
Gold protects you against your own currency, which is not always the same as protecting you in dollars. During the 1997 Asian financial crisis the dollar price of gold kept sliding, yet the Korean won, Thai baht and Indonesian rupiah lost 50–80%, so gold soared in local terms; Korean households donated about 227 tonnes of it in a national campaign. In China since 2021 the story has been similar. While home prices fell and the property downturn dragged on, the People's Bank of China bought gold from late 2022 and the renminbi price more than doubled. If your savings are in a currency under pressure, gold's crisis record looks better than the dollar charts suggest.
How can you track gold's crisis signals in real time?
You can follow the same signals on PickSkill's live signal board, which updates daily. Three lights matter most for gold. The stocks-and-gold co-drop flags forced selling. The Fed balance sheet flags money printing, the usual trigger for gold's rally. The 12-month gold trend flags when the move is already stretched. To apply this to your own holdings, ask PickSkill's AI analyst how your portfolio would have behaved in 2008, or read how inflation data moves markets in our guide to what CPI means for stocks.
FAQ
Is gold a safe haven in a stock market crash? Not in the first days or weeks. In 2008 and 2020 gold fell with stocks during the panic because investors sold it to raise cash. It became a safe haven later, once central banks started printing money: gold then bottomed before stocks and led the recovery.
How much did gold fall in 2008? COMEX gold futures fell 29.7%, from $1,003 on 18 March 2008 to $705 on 13 November 2008. The S&P 500 did not bottom until 9 March 2009, 116 days later. By August 2011 gold had risen 168% from its low.
Why did gold fall in March 2020? Funds and companies needed US dollars urgently, so they sold liquid assets, including gold and even US Treasuries. Gold fell 11.8% between 9 and 18 March 2020, bottomed five days before the S&P 500 and reached a record of about $2,069 on 6 August 2020.
What makes gold go down for years after a crisis? Rising real interest rates. When savings earn more than inflation, holding gold, which pays nothing, becomes less attractive. Gold fell for twenty years after Volcker's hikes in 1980 and about 45% between 2011 and 2015.
Does gold always bottom before stocks? No. In crises driven by rising rates rather than a credit collapse, such as 2022, gold bottomed after stocks. In the 1970s stagflation, gold rose throughout the stock bear market. The pattern holds best in debt-driven crises where central banks respond by printing money.