When Do House Prices Bottom After a Crash? 5 Markets
House prices bottom last: 6 years after the peak in Hong Kong, 5.6 in the US, 18 in Japan. Data on 5 housing busts and how far behind stocks they turned.

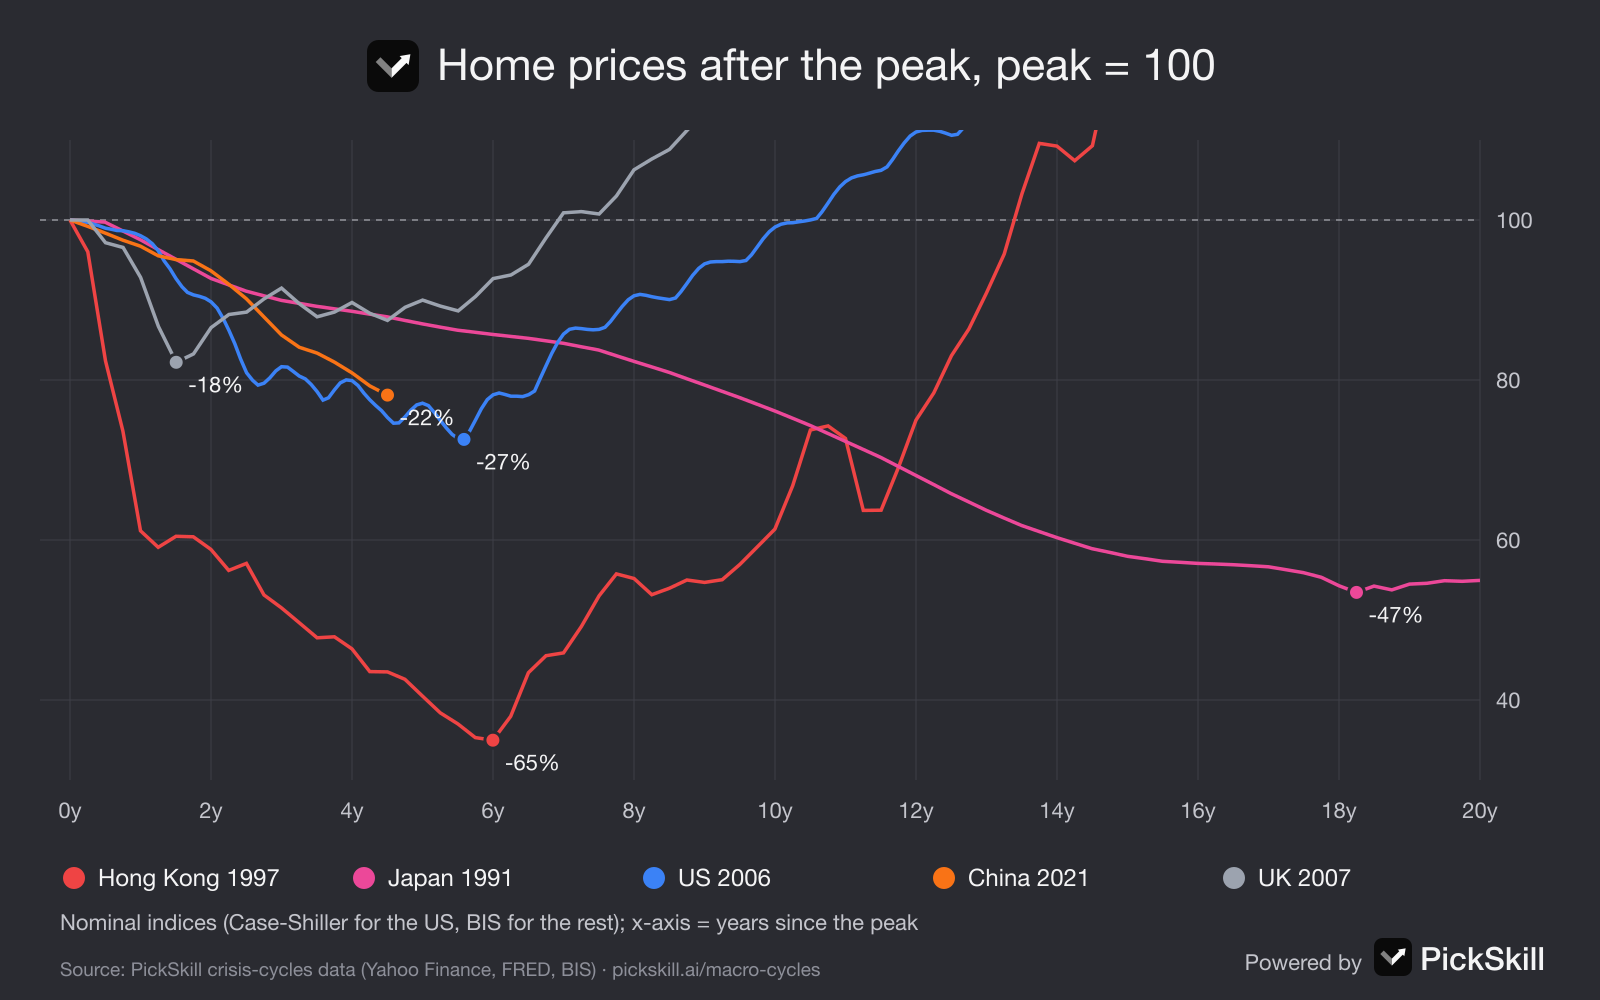
After a property-led crash, house prices usually bottom last of the four big asset classes, two to ten or more years after stocks. In nominal terms US home prices took 5.6 years to bottom after the 2006 peak (−27%), Hong Kong took 6 years after 1997 (−65%) and Japan 18 years after 1991 (−47%). When housing is not the centre of the crisis, the opposite happens: lower interest rates push prices up, as in the US in 2000–02 (+24%) and 2020–22 (+45%). The key question is whether property and mortgage credit caused the crisis.
The data below comes from PickSkill's crisis cycles page, which charts home prices next to cash, gold and stocks for every major crisis since 1929. Each link opens the relevant crisis on that page.
Key takeaways
- Housing is first to top and last to bottom when property is the epicentre: US 2006 peak → 2012 low; Japan 1991 → 2009; Hong Kong 1997 → 2003.
- Typical lag behind stocks: 3 to 6 years. US stocks bottomed in March 2009, US homes in February 2012. Hong Kong stocks bottomed in August 1998, homes in mid-2003.
- Depth depends on leverage and the currency regime. Hong Kong's peg forced the whole adjustment onto local prices: −65%.
- Not the epicentre? Housing wins. US home prices rose 24% in the dot-com bust and 45% after COVID.
- China is still in it. BIS data show Chinese home prices 21.9% below their July 2021 peak as of early 2026.
Why do house prices bottom so late?
House prices bottom late because housing is slow on every dimension. Sales take months, prices are set by appraisals of recent sales, most owners are not forced to sell, and the buyers who set the margin depend on mortgage credit that recovers only after banks have repaired their balance sheets. Stocks reprice in seconds and look a year ahead; housing reprices over years and looks backwards. That is why, on PickSkill's model, housing ranks last in the first half of a crisis and only catches up late in the second half. It also explains the order in which assets bottom, the third of the page's six regularities: gold first, then stocks, then housing.
How long did house prices take to recover in past crashes?
They took between 1.5 and 18 years to hit bottom, and longer still to regain the peak. The table measures each episode on nominal indices: Case-Shiller for the US and BIS residential property prices for the other markets.
| Market | Peak | Trough | Fall | Years to trough | Local stocks bottomed |
|---|---|---|---|---|---|
| Hong Kong | Q3 1997 | Q3 2003 | −65.0% | 6.0 | Aug 1998 |
| Japan | Q1 1991 | Q2 2009 | −46.5% | 18.2 | Apr 2003 |
| United States | Jul 2006 | Feb 2012 | −27.4% | 5.6 | Mar 2009 |
| China | Q3 2021 | not yet | −21.9% so far | 4.5+ | Oct 2022 (Hang Seng) |
| United Kingdom | Q3 2007 | Q1 2009 | −17.8% | 1.5 | Mar 2009 |
Source: PickSkill crisis-cycles data (S&P CoreLogic Case-Shiller via FRED; BIS via FRED). Real, inflation-adjusted falls were larger, especially in Japan, where commercial land in the six biggest cities fell about 87% from 1991 to 2005.
Why do some housing busts last so much longer?
Three things have stretched housing busts: leverage, the response of policy, and the currency regime. Japan combined all three badly. The Bank of Japan cut slowly, zero rates came only in 1999, quantitative easing in 2001, and banks kept rolling over bad property loans for a decade, so prices drifted down for eighteen years. In Hong Kong the peg to the dollar meant interest rates had to rise to defend the currency in 1997–98, with overnight rates near 300% at one point, and local prices had to absorb the whole adjustment. The US fall was shorter because the Fed cut to zero and printed money within about a year and a half of the credit crunch, and the UK, where the Bank of England cut to 0.5% and started QE in early 2009, bottomed within eighteen months. PickSkill summarises this as the fourth regularity: the epicentre decides what housing does.
What happens to house prices when housing is not the epicentre?
When the crisis starts somewhere else, housing usually benefits, because falling interest rates make mortgages cheaper while the panic is in stocks or credit. In the dot-com bust the S&P 500 fell 49%, yet US home prices rose 24% between March 2000 and October 2002 as the Fed cut to 1%. That boom grew into the 2006 bubble. In the COVID crash US home prices rose 45% between February 2020 and June 2022 as mortgage rates fell below 3%. China in 2015–16 was similar: after the stock crash, easing and a destocking push sent tier-1 city prices up 30–50%. So the useful question is not "will house prices fall in a recession?" but "is property where the debt problem sits?"
Where is China's housing market in the cycle?
China's property downturn is the clearest current case of housing as the epicentre. Developer credit was cut off by the "three red lines" in August 2020, Evergrande defaulted in late 2021, and BIS data show nominal home prices 21.9% below their July 2021 peak as of January 2026, still falling 6.3% a year. On PickSkill's China housing signal, that is an alert. The pattern from Japan and Hong Kong suggests two things to watch. First, stocks tend to turn well before housing, and Hong Kong and mainland stocks bottomed in 2022 and 2024, with the September 2024 stimulus as the first "whatever it takes"-style signal. Second, housing bottoms have needed a large balance-sheet backstop, not just rate cuts. You can follow the whole cycle on the timeline zoomed to China's property downturn.
How can you track housing risk in real time?
You can watch two housing lights on PickSkill's live signal board: US home prices and China home prices, each compared with a year earlier, with an alert below −3%. Because housing data are published with a lag of one to three months, combine them with faster market signals such as credit spreads and bank stocks. For a view on your own exposure, for example REITs, homebuilders or banks with property loans, ask PickSkill's AI analyst to check them against the 2008 and 1997 paths, or set up a portfolio with daily indicator tracking.
FAQ
How long does it take house prices to recover after a crash? In property-led crashes, nominal prices took 5.6 years to bottom in the US after 2006, 6 years in Hong Kong after 1997 and about 18 years in Japan after 1991. Regaining the old peak took longer: about 10 years in the US and over 13 years in Hong Kong.
Do house prices fall in every recession? No. When housing is not the cause of the crisis, lower interest rates usually lift prices. US home prices rose 24% during the 2000–02 dot-com bust and 45% between February 2020 and June 2022.
Do house prices bottom before or after stocks? After. US stocks bottomed in March 2009 and US home prices in February 2012; Hong Kong stocks bottomed in August 1998 and home prices in mid-2003. Gold has usually bottomed first, then stocks, then housing.
How much did Japanese property prices fall? BIS data show Japan's nominal residential property index fell 46.5% from 1991 to 2009. Commercial land in Japan's six largest cities fell about 87% between 1991 and 2005.
Has China's housing market bottomed? Not as of the latest BIS data for January 2026: Chinese home prices were 21.9% below their July 2021 peak and still 6.3% lower than a year earlier. Past property-led downturns ended only after a large balance-sheet backstop.