DCF Model Excel Template: How a Live 5-Year DCF Works
What a working DCF model in Excel contains, sheet by sheet: unlevered FCF, discounting, terminal value and a WACC × growth grid, with a worked example.
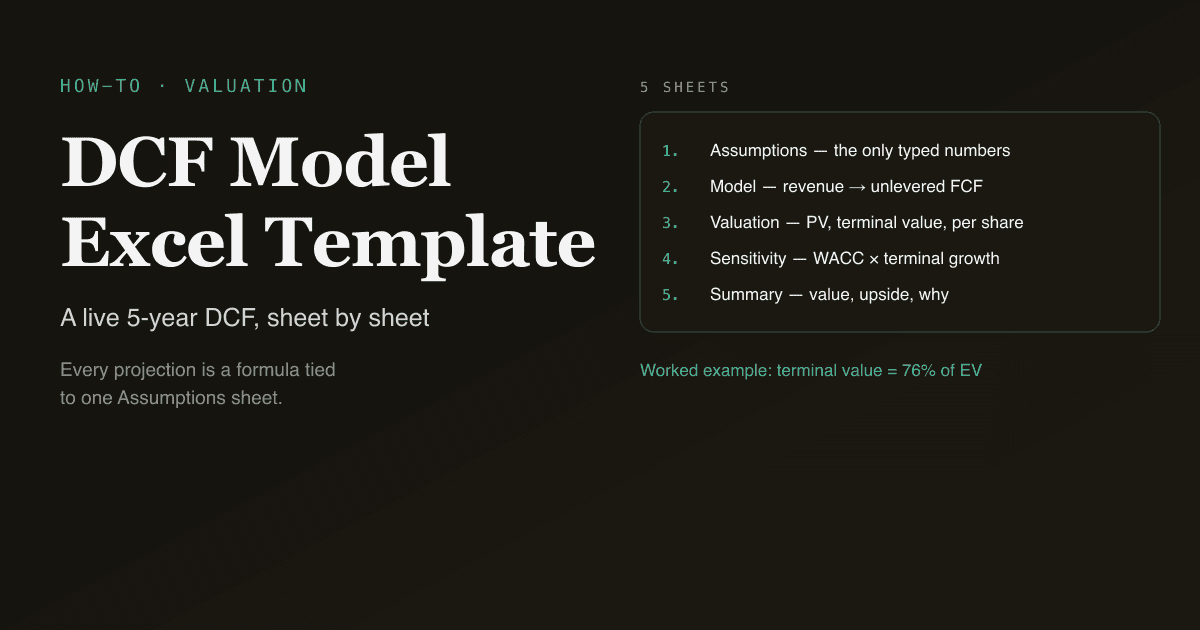
A DCF model Excel template is a workbook that turns a handful of assumptions (revenue growth, margins, reinvestment, WACC and terminal growth) into an intrinsic value per share, using formulas rather than typed-in numbers. The test of a good one is simple: change any input and every projection, the valuation and the sensitivity table recalculate. This guide walks through the five sheets such a model needs, the exact formulas behind each, and a worked example you can check by hand.
Key takeaways
- A usable DCF template has five parts: Summary, Assumptions, Model (projections), Valuation and Sensitivity. Inputs live in one place; everything else is a formula.
- The cash flow you discount is unlevered free cash flow: EBIT × (1 − tax) + D&A − capex − increase in net working capital.
- Terminal value usually dominates. In the worked example below it is 76% of enterprise value, which is why a WACC × terminal-growth grid matters more than any single output.
- The most common template bugs are hard-coded numbers inside projections, terminal growth set at or above WACC, and net debt subtracted twice or not at all.
What sheets should a DCF Excel template have?
A DCF workbook works best split into five sheets, each with one job:
| Sheet | What it holds | Rule |
|---|---|---|
| Assumptions | Base-year revenue, five years of growth and EBIT margin, tax rate, D&A, capex, working capital, WACC, terminal growth, net debt, diluted shares, current price | The only sheet with typed numbers. Mark inputs visually (the sell-side convention is blue text on a pale-yellow fill) |
| Model | Five projected years: revenue, EBIT, NOPAT, D&A, capex, ΔNWC, unlevered FCF, discount factor, present value | Every cell is a formula pointing at Assumptions or the row above |
| Valuation | Sum of PV of FCF, terminal value, PV of terminal value, enterprise value, net debt, equity value, value per share, upside vs price | No inputs; reads Model and Assumptions |
| Sensitivity | Value per share across a grid of WACC and terminal growth | Each cell re-runs the full DCF at that pair |
| Summary | Value per share, upside, the key assumptions and a few lines on why you chose them | What you show someone else |
Keeping inputs on one sheet is what makes the model honest: anyone can see every assumption that drives the answer, and nothing is buried in a projection cell.
What formulas does each year of the model use?
Each projected year runs the same chain. With revenue growth g, EBIT margin m and tax rate t:
- Revenue = prior-year revenue × (1 + g)
- EBIT = revenue × m
- NOPAT = EBIT × (1 − t)
- D&A = revenue × D&A %
- Capex = revenue × capex %
- ΔNWC = (revenue − prior-year revenue) × NWC % of the change
- Unlevered FCF = NOPAT + D&A − capex − ΔNWC
- Discount factor = 1 / (1 + WACC)^n, where n is the year number (1 to 5)
- PV of FCF = unlevered FCF × discount factor
Then, on the Valuation sheet:
- Terminal value (Gordon growth) = FCF in year 5 × (1 + terminal growth) / (WACC − terminal growth)
- Enterprise value = sum of PV of FCF + terminal value × year-5 discount factor
- Equity value = enterprise value − net debt (add net cash if net debt is negative)
- Value per share = equity value / diluted shares
This is end-of-year discounting. Some analysts use a mid-year convention, which raises the value slightly; whichever you choose, say so on the Summary sheet. If you need a refresher on the inputs themselves, see what DCF is and how WACC is built.
What does a worked DCF example look like?
Here is an illustrative company, not a real one, so you can check the arithmetic: base-year revenue 1,000 (in millions), 10% growth for five years, 20% EBIT margin, 21% tax, D&A 4% and capex 5% of revenue, ΔNWC 10% of the revenue increase, WACC 9%, terminal growth 2.5%, net debt 200, 100 million diluted shares, current price 25.
| Year | Revenue | EBIT | NOPAT | D&A | Capex | ΔNWC | Unlevered FCF | PV of FCF |
|---|---|---|---|---|---|---|---|---|
| 2026 | 1,100.0 | 220.0 | 173.8 | 44.0 | 55.0 | 10.0 | 152.8 | 140.2 |
| 2027 | 1,210.0 | 242.0 | 191.2 | 48.4 | 60.5 | 11.0 | 168.1 | 141.5 |
| 2028 | 1,331.0 | 266.2 | 210.3 | 53.2 | 66.5 | 12.1 | 184.9 | 142.8 |
| 2029 | 1,464.1 | 292.8 | 231.3 | 58.6 | 73.2 | 13.3 | 203.4 | 144.1 |
| 2030 | 1,610.5 | 322.1 | 254.5 | 64.4 | 80.5 | 14.6 | 223.7 | 145.4 |
Valuation:
- Sum of PV of FCF: 713.9
- Terminal value: 223.7 × 1.025 / (0.09 − 0.025) = 3,527.8, worth 2,292.8 today
- Enterprise value: 3,006.7; equity value after net debt: 2,806.7
- Value per share: 28.07, or 12.3% above the 25 share price
Notice that the terminal value supplies 76% of enterprise value. Five years of explicit forecasting decide only a quarter of the answer; the long-run assumptions decide the rest.
How do you read the sensitivity table?
Because terminal value dominates, a single value per share is less useful than the range around it. The Sensitivity sheet re-runs the whole DCF for each pair of WACC (rows) and terminal growth (columns):
| WACC ↓ / g → | 2.00% | 2.25% | 2.50% | 2.75% | 3.00% |
|---|---|---|---|---|---|
| 8.0% | 31.22 | 32.42 | 33.72 | 35.14 | 36.71 |
| 8.5% | 28.59 | 29.58 | 30.66 | 31.83 | 33.10 |
| 9.0% | 26.33 | 27.16 | 28.07 | 29.04 | 30.10 |
| 9.5% | 24.37 | 25.08 | 25.85 | 26.67 | 27.56 |
| 10.0% | 22.66 | 23.27 | 23.93 | 24.63 | 25.38 |
A one-point move in WACC swings the value from about 24 to 34 per share at the same growth rate. If the share price (25) sits inside the plausible part of the grid, the DCF is not telling you the stock is mispriced; it is telling you which assumption you would have to be confident about. That is the honest way to present a DCF.
What mistakes break DCF templates?
- Hard-coded numbers inside the Model sheet. One typed-over cell silently breaks the link to Assumptions, and the sensitivity table stops meaning anything. Keep every number in Assumptions.
- Terminal growth at or above WACC. The Gordon formula divides by (WACC − g); as they converge, value explodes. Long-run growth above nominal GDP growth (roughly 2–4%) needs a reason.
- Mixing levered and unlevered. Unlevered FCF is discounted at WACC to get enterprise value, then net debt is subtracted. Discounting levered FCF at WACC, or forgetting net debt, double-counts or drops the debt.
- Basic instead of diluted shares. Use diluted shares, in the same unit as the money inputs (millions with millions).
- Margins that never converge. If EBIT margin rises every year to the end of the forecast, the terminal value capitalises that peak forever. Let margins settle before year 5.
How do you get this template for a real company?
You can build the workbook above from scratch in about an hour once the formulas are clear. PickSkill's AI analyst can also generate it for you: ask in plain language, for example "Build a 5-year DCF for Apple in Excel, WACC 8.5%, terminal growth 2.5%", and it pulls the base-year figures from the latest filings and returns an .xlsx with the five sheets described here. Every projected figure is a live formula tied to one input cell, so you can overwrite any assumption and the valuation and sensitivity grid recompute.
Treat the AI's starting assumptions as a first draft, not a forecast: the point of the template is that you can see and change every one of them. For a walkthrough of the workflow, read build a DCF in 60 seconds; to sanity-check the answer against peers, see DCF vs comparable company analysis. Generated files count toward your plan's monthly file quota; see pricing.
FAQ
Is there a free DCF model template in Excel? Yes. You can build one from the formulas on this page in a blank workbook, and PickSkill's free plan includes one generated file a month, enough to try a company-specific DCF workbook; Pro includes 30. Whatever template you use, check that the projections are formulas tied to one assumptions sheet.
What discount rate should a DCF use? Unlevered free cash flow is discounted at the weighted average cost of capital (WACC): the after-tax cost of debt and the cost of equity, weighted by their share of capital. For large, stable companies WACC often lands between about 7% and 10%; the sensitivity grid shows how much the answer depends on it.
Why is terminal value such a large part of a DCF? Because it captures every year after the explicit forecast. With a 9% WACC and 2.5% terminal growth, the example on this page gets 76% of its enterprise value from the terminal value. That is normal, and it is why a DCF should be presented as a range, not a single price target.
How many years should a DCF forecast? Five years is the common default and what this template uses. Use more (seven to ten) when a company is still far from a steady state, for example a fast grower whose margins have not converged; the explicit forecast should end once growth and margins have settled.
Can I use this template for Hong Kong or A-share companies? Yes. The method is the same; set the currency and unit on the Assumptions sheet (for example HKD millions or 亿元) and keep shares in the same scale. PickSkill covers US, Hong Kong and A-share tickers.