CSI 300 MACD Golden Cross Screen: 41 Hits to 1
A real CSI 300 screen: 41 MACD golden crosses in 3 days, cut to 1 by MA, money-flow, volume and ADX filters. Funnel table, final names and A-share caveats.
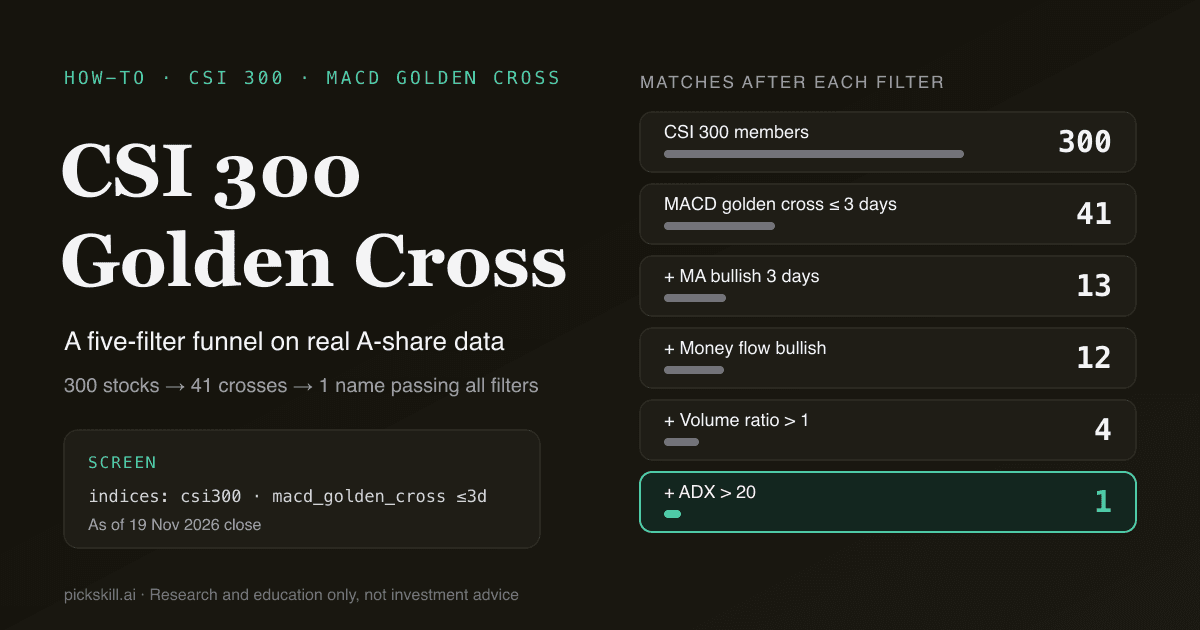
A MACD golden cross screen on the CSI 300 only gives you a candidate list; the confirmation filters you stack on top are what make it usable. A CSI 300 MACD golden cross screen is a workflow that first finds index members whose DIF line crossed above the DEA line in the last few sessions, then narrows them with trend, money-flow, volume and trend-strength filters. As of the 19 Nov 2026 close, 41 of the 300 members had a golden cross within 3 trading days, and only 1 survived four confirmation filters.
This post does not repeat the general theory of confirming a cross. For that, read How to Confirm a MACD Golden Cross. Here we apply those ideas to China's large-cap benchmark with the PickSkill signal screener, record how many names survive each filter, and explain how A-share price limits and T+1 settlement change the reading.
Key takeaways
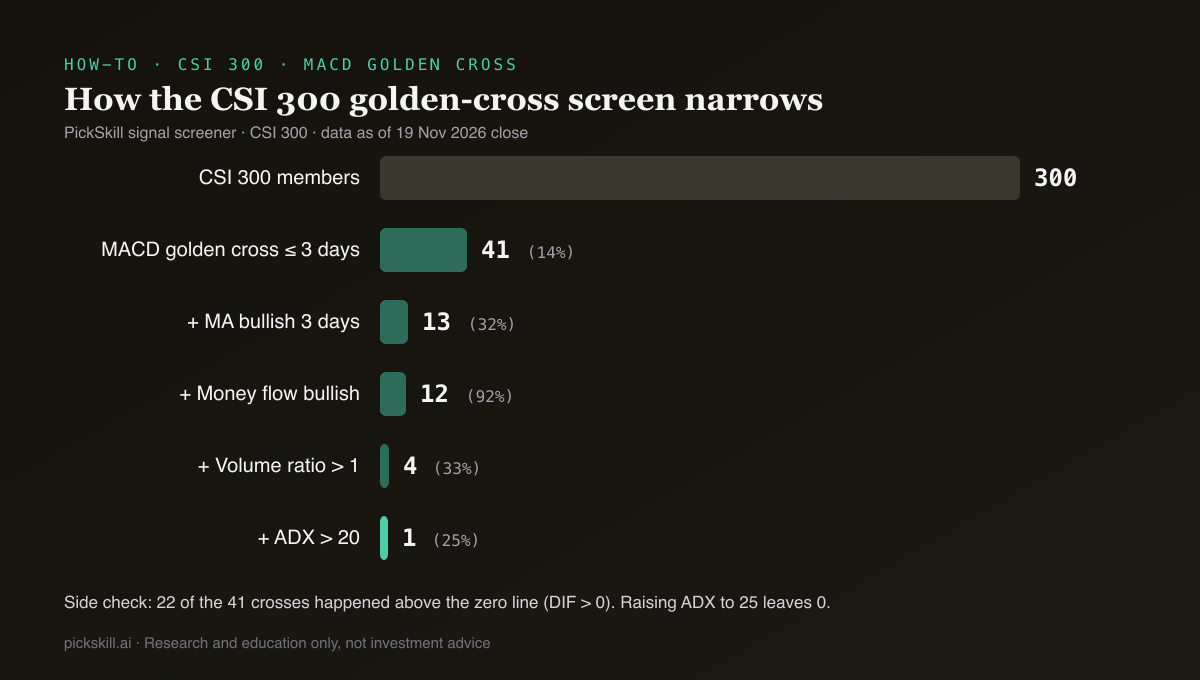
- As of the 19 Nov 2026 close, 41 CSI 300 members (14%) showed a MACD golden cross within 3 sessions; 22 of them crossed above the zero line.
- Requiring a bullish moving-average stack for 3 days cut the list to 13, the biggest single drop.
- Adding bullish money flow left 12, volume ratio above 1 left 4, and ADX above 20 left 1: Hikvision (002415.SZ).
- Raising the ADX bar to 25 left 0, so most of these crosses happened without a strong trend behind them.
- PickSkill forces one-price limit and halt days (high equals low) to neutral, but limit-up days with an intraday range are not masked and need a manual check.
- Every number here illustrates a method. Nothing in this post is a recommendation to buy or sell.
How do you screen the CSI 300 for a MACD golden cross?
The direct method has two steps. First, use an event condition to find members whose MACD golden cross happened within the last N trading days. Then add confirmation filters, all combined with AND. In the PickSkill screener, set the universe to CSI 300 and the first condition to "MACD golden cross within 3 trading days". After the 19 Nov 2026 close, that step returned 41 of 300 stocks. The cross is DIF moving above DEA on the standard (12, 26, 9) settings. A 3-day window, rather than today only, fits A-share mechanics: the signal is only final after the close, you can only act the next session, and a short window catches crosses around a weekend without pulling in moves that are already well advanced. The count alone tells you why one condition is not enough: one in seven index members flashed a cross in the same window.
If you call the screener through the MCP server or the REST API, the first step looks like this:
{
  "indices": ["csi300"],
  "conditions": [
    { "type": "event", "event": "macd_golden_cross", "within_days": 3 }
  ]
}
Which confirmation filters should follow the cross?
We stacked four filters on the cross. Each one targets a common reason golden crosses fail: price is not yet trending, money is not flowing in, volume is not expanding, or the trend is too weak. We chose these four rather than KDJ or Bollinger Bands because they come from four separate dimensions (price structure, money flow, volume and trend strength), and filters only add information when they measure different things. The funnel below is the real result on the CSI 300 after the 19 Nov 2026 close; "kept" is the share of the previous step that survived. The moving-average step removed the most names (41 to 13), while money flow barely changed the list (13 to 12), because stocks with a bullish MA stack usually already show positive flow.
| Step | Condition | Screener syntax | Matches | Kept |
|---|---|---|---|---|
| 0 | CSI 300 members | indices: ["csi300"] | 300 | — |
| 1 | MACD golden cross, last 3 sessions | event: macd_golden_cross, within_days: 3 | 41 | 14% |
| 2 | MA bullish, 3 days in a row | signal: ma = bullish, days: 3 | 13 | 32% |
| 3 | Money flow bullish | signal: flow = bullish | 12 | 92% |
| 4 | Volume ratio > 1 | value: volume.volRatio > 1 | 4 | 33% |
| 5 | ADX > 20 | value: adx.adx > 20 | 1 | 25% |
Source: PickSkill signal screener, CSI 300, 19 Nov 2026 close.
What does each filter actually measure?
The filter names look like any charting tool, but the definitions decide the result, so here they are as written in PickSkill's indicator code. The same definitions apply to US, Hong Kong and A-share stocks:
- MA bullish: close > MA5 > MA20 > MA60. Requiring 3 consecutive days rules out stocks that poked above their averages only on the day of the cross.
- Money flow bullish: a daily flow estimate of direction × volume × close, summed over 5 and 20 days; both sums must be positive. This is a daily-bar proxy, not the Level-2 "main force" flow that Chinese trading apps show, and the two can disagree.
- Volume ratio > 1: today's volume divided by the 20-day average volume. Many Chinese trading apps define 量比 differently (per-minute volume against the past 5 sessions), so the numbers are not interchangeable.
- ADX > 20: ADX(14) measures trend strength, not direction. PickSkill treats ADX below 20 as "no clear trend" and sets the ADX dimension to neutral.
To run the whole screen at once, put all five conditions in one conditions array; the screener accepts up to 8.
Which CSI 300 stocks passed the screen?
Four stocks passed the first four filters (cross, MA bullish 3 days, money flow bullish, volume ratio above 1), all on 19 Nov 2026 closing data. Only Hikvision had an ADX above 20; the other three were still below that trend-strength line. The table shows the screener's evidence. Each stock page has the full 8-dimension read and the 5-day signal trail.
| Stock | Ticker | Close (CNY) | Cross | DIF / DEA | Vol ratio | ADX | RSI(14) |
|---|---|---|---|---|---|---|---|
| Hikvision (海康威视) | 002415.SZ | 35.71 | 2 days ago | 0.39 / 0.33 | 1.05 | 20.22 | 61.1 |
| NARI Technology (国电南瑞) | 600406.SH | 24.84 | 2 days ago | 0.38 / 0.27 | 1.09 | 18.31 | 68.3 |
| China Mobile (中国移动) | 600941.SH | 107.80 | 2 days ago | 1.63 / 1.08 | 1.01 | 15.63 | 65.6 |
| CRSC (中国通号) | 688009.SH | 5.12 | Today | 0.05 / 0.05 | 1.14 | 19.67 | 60.1 |
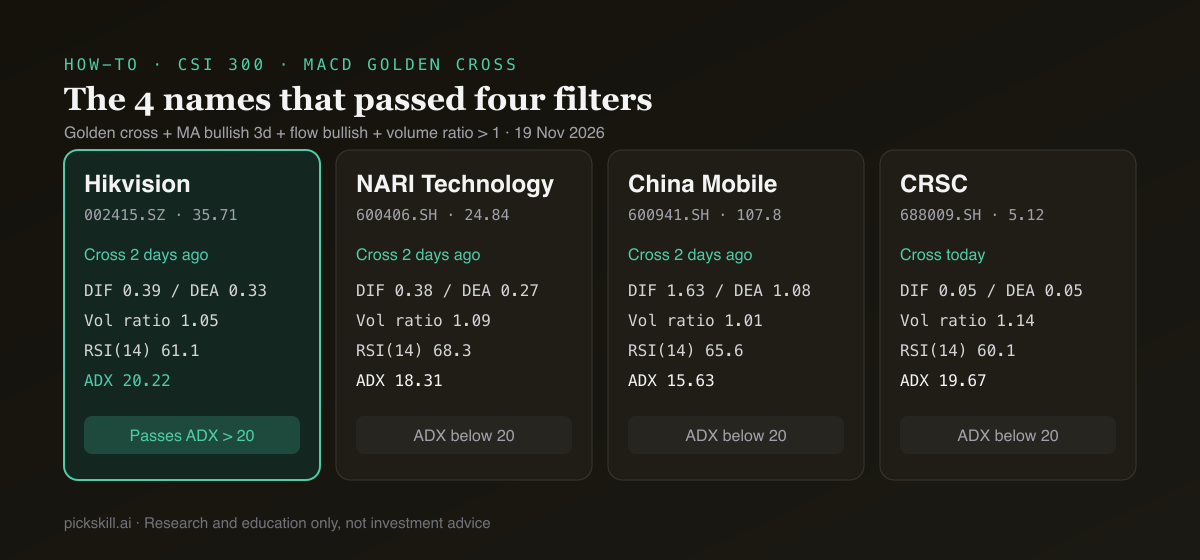
Three details matter. All four crosses sit above the zero line (positive DIF). CRSC's DIF and DEA are both 0.05, so the cross is brand new and the next one or two histogram bars will say more than the cross itself. And the volume ratios range only from 1.01 to 1.14: volume is slightly above average, not surging.
The money-flow filter removed China Merchants Expressway (001965). The volume filter removed China Resources Sanjiu, Sichuan Chuantou Energy, Agricultural Bank of China, Bank of Communications, CRRC, Huadian Power, Sinopec and YTO Express. Also, of the first 30 crosses the screener returned, 16 happened on the same session (2 days ago). A cluster like that looks like an index-wide rebound rather than stock-specific news, which is why stock-level confirmation matters.
How do A-share price limits and T+1 affect the screen?
Price limits and T+1 settlement are the two biggest differences from screening US stocks: limits distort the signal, and T+1 limits what you can do with it. Daily limits are ±10% on the main boards, ±20% on ChiNext and STAR, and, since 6 July 2026, ±10% for main-board ST stocks too (previously ±5%). On a one-price limit-up day the high equals the low, which breaks range-based indicators such as KDJ, ADX and Bollinger Bands. PickSkill flags any bar where high equals low (a one-price limit day or a halt) and forces all 8 dimensions to neutral for that day, so a streak of locked limit-ups cannot fake a strong signal. MACD uses closes only and is not masked, but crosses after a limit streak tend to arrive 1–2 bars late, as covered in MACD on A-Shares vs US.
The mask only catches high-equals-low bars. A limit-up that opened intraday still has a range and is not masked, so if a candidate hit its limit recently, check the chart.
T+1 means shares bought today can be sold tomorrow at the earliest. The cross is confirmed at the close, so the first actionable session is the next one, and a gap down that day cannot be exited the same day. That is part of why we use a 3-day window and require 3 days of bullish MAs: in a market where you cannot correct intraday, a slower but steadier signal is worth it. For a wider view of which indicators suit A-shares, see Top 5 Technical Indicators for Chinese A-Shares.
Can you run the same screen on Hong Kong stocks or weekly charts?
Yes for Hong Kong, with one caveat for weekly charts. The screener's golden cross event is computed on daily bars, and the universe can be the Hang Seng, S&P 500 or Nasdaq-100 as well as the CSI 300. To screen Hong Kong names such as Tencent (0700.HK), switch indices to hsi and keep the same filters.
The screener has no weekly event yet. The practical route is to screen on daily conditions, then check the weekly DIF direction on the stock page or with the AI analyst. A rising weekly DIF tends to make a daily cross more durable, which is the weekly-trend check in the confirmation guide.
How do you reproduce this screen on PickSkill?
The whole workflow takes about a minute, and the data refreshes after every market close:
- Open the signal screener and pick CSI 300 as the universe. The CSI 300 index hub shows the members' overall signal mix first if you want context.
- Add "MACD golden cross within 3 trading days" and note the match count.
- Add "MA bullish for 3 days", "money flow bullish", "volume ratio > 1" and "ADX > 20" one by one, noting the count each time to build your own funnel.
- Open each remaining stock page (for example Kweichow Moutai) to check the 8 signals, the 5-day trail and any limit days.
- For a fuller read, send a candidate to the AI Panel, where five models review the same fact sheet.
The screener is part of the Pro and Power plans (a 7-day free trial on the first plan); Free users see the match count but not the names. See pricing. Counts change every session: 41 to 1 is the result for 19 Nov 2026, not a fixed ratio.
All data in this post is for research and education only, not investment advice. CSI 300 index rules are published by China Securities Index Co.
FAQ
How many confirmation filters should a MACD golden cross screen use? There is no fixed number; it depends on how long a list you want. On the CSI 300 on 19 Nov 2026, one MA filter cut 41 crosses to 13, and four filters left just 1. Too few filters leave many false signals, too many can leave nothing. Start with two or three filters from different dimensions and adjust after seeing the counts.
How many CSI 300 stocks have a MACD golden cross on a typical day? It varies daily. After the 19 Nov 2026 close, 41 members (about 14%) had a cross within the last 3 sessions. During an index-wide rebound, crosses cluster on the same day and the count rises; in a steady decline it falls. The count itself is a rough gauge of market breadth.
Do limit-up stocks show up in a golden cross screen? They can. On a one-price limit day PickSkill sets all 8 dimensions to neutral, so that day cannot help a stock pass signal filters such as MA bullish. The MACD cross event uses closing prices, though, so a cross can still appear after a limit streak, usually 1–2 days late. Check recent limit days on the stock page before trusting it.
Is PickSkill's volume ratio the same as 量比 in Chinese trading apps? No. PickSkill's volume ratio is today's volume divided by the 20-day average, using daily bars. Many Chinese apps calculate 量比 from per-minute volume against the past 5 sessions. The two usually point the same way, but the values are not interchangeable, so set thresholds using the definition of the tool you are screening in.
What conditions confirm a MACD golden cross? Common checks are a cross above the zero line, a histogram that grows after the cross, a rising weekly trend, expanding volume, and price above a key moving average. The reasoning behind each is in PickSkill's golden cross confirmation guide; this post turns the measurable parts into a CSI 300 screen with real data.