Financial Crisis Warning Signs: 11 Signals to Watch
The yield curve, credit spreads, VIX, the dollar and the Fed: 11 crisis warning signals with the levels that flashed in 2008 and 2020, and today's readings.
The most reliable warning signs of a financial crisis are an inverted yield curve, widening credit spreads, a spiking VIX, a surging US dollar, stocks and gold falling together, and a central bank that starts cutting. Each has crossed a clear threshold before or during past crises: every US recession since 1980 followed a curve inversion by 6–19 months, the Baa credit spread peaked at 6.2% in 2008, and the VIX closed above 80 in both 2008 and 2020. No single signal is enough. What has mattered is how many flash at once and in what order. PickSkill's live signal board checks eleven of them against fixed thresholds every day; on data to 13 November 2026 its rule-based reading was "no crisis signal", with two amber lights and one red.
This guide explains each signal, the level that matters and what it did in past crises. Every signal name links to its live card on PickSkill's crisis cycles page.
Key takeaways
- Late-cycle signals come first: an inverted yield curve, the first Fed cut and slowing home prices.
- Panic signals mark the climax: VIX above 30, a credit spread above 3.5%, a dollar squeeze and stocks and gold falling together.
- The turning-point signal is policy: a Fed balance sheet growing 5% in three months has meant crisis-scale money printing.
- Count the lights. Two or more panic signals at once has historically meant the first half of a crisis; one alone is usually noise.
- Today (13 Nov 2026): curve +0.27%, VIX 20.0, credit spread 1.48%, S&P 500 3.3% below its high. Amber: the dollar (+3.8% in 3 months) and the Fed cycle. Red: China home prices (−6.3% a year).
What are the early warning signs of a financial crisis?
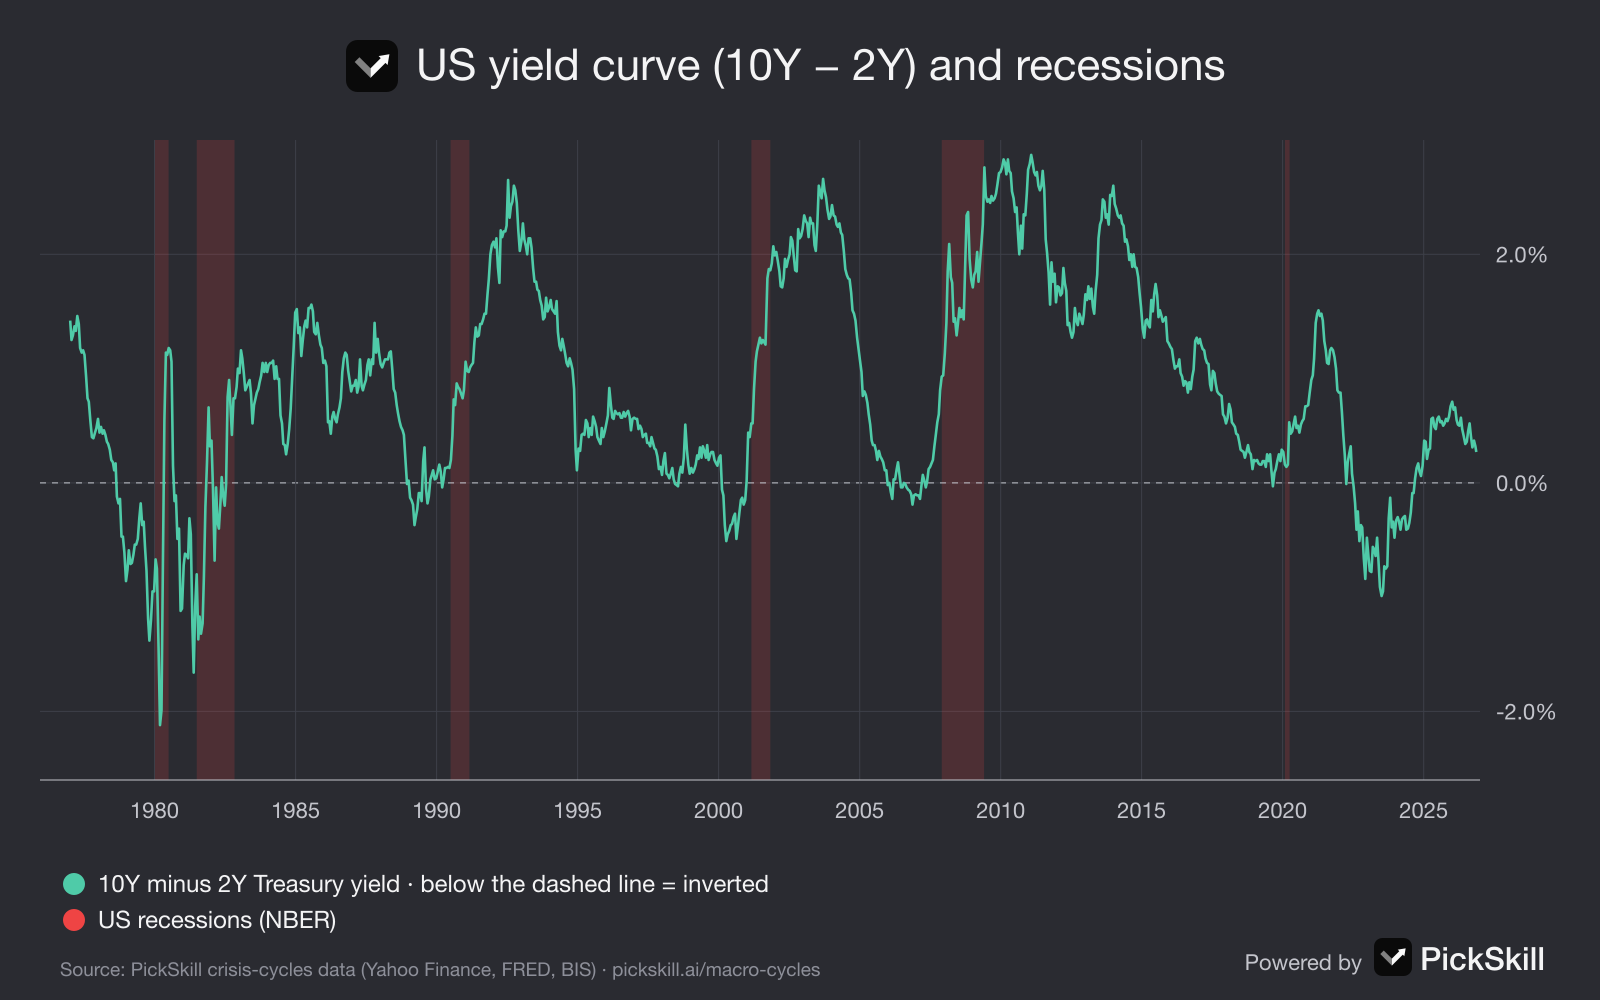
The early warning signs are the ones that change while markets still look calm. PickSkill groups them as eve-of-crisis signals. The first is the yield curve: when 10-year Treasury yields fall below 2-year yields, investors expect the Fed to cut because growth will slow. The curve inverted before all six US recessions since 1980, starting 6 to 19 months ahead, and the recession tended to arrive after it turned positive again. Not every inversion has led to one: brief dips in 1998 did not, and the 2022–24 inversion, the longest on record at 784 days, is still being tested. The second is the Fed's first rate cut, which in recession cycles has come near the market top rather than the bottom. The third is housing, where turnover and then prices weaken first: US home prices peaked in July 2006, fifteen months before stocks.
Which signals show a crisis is already under way?
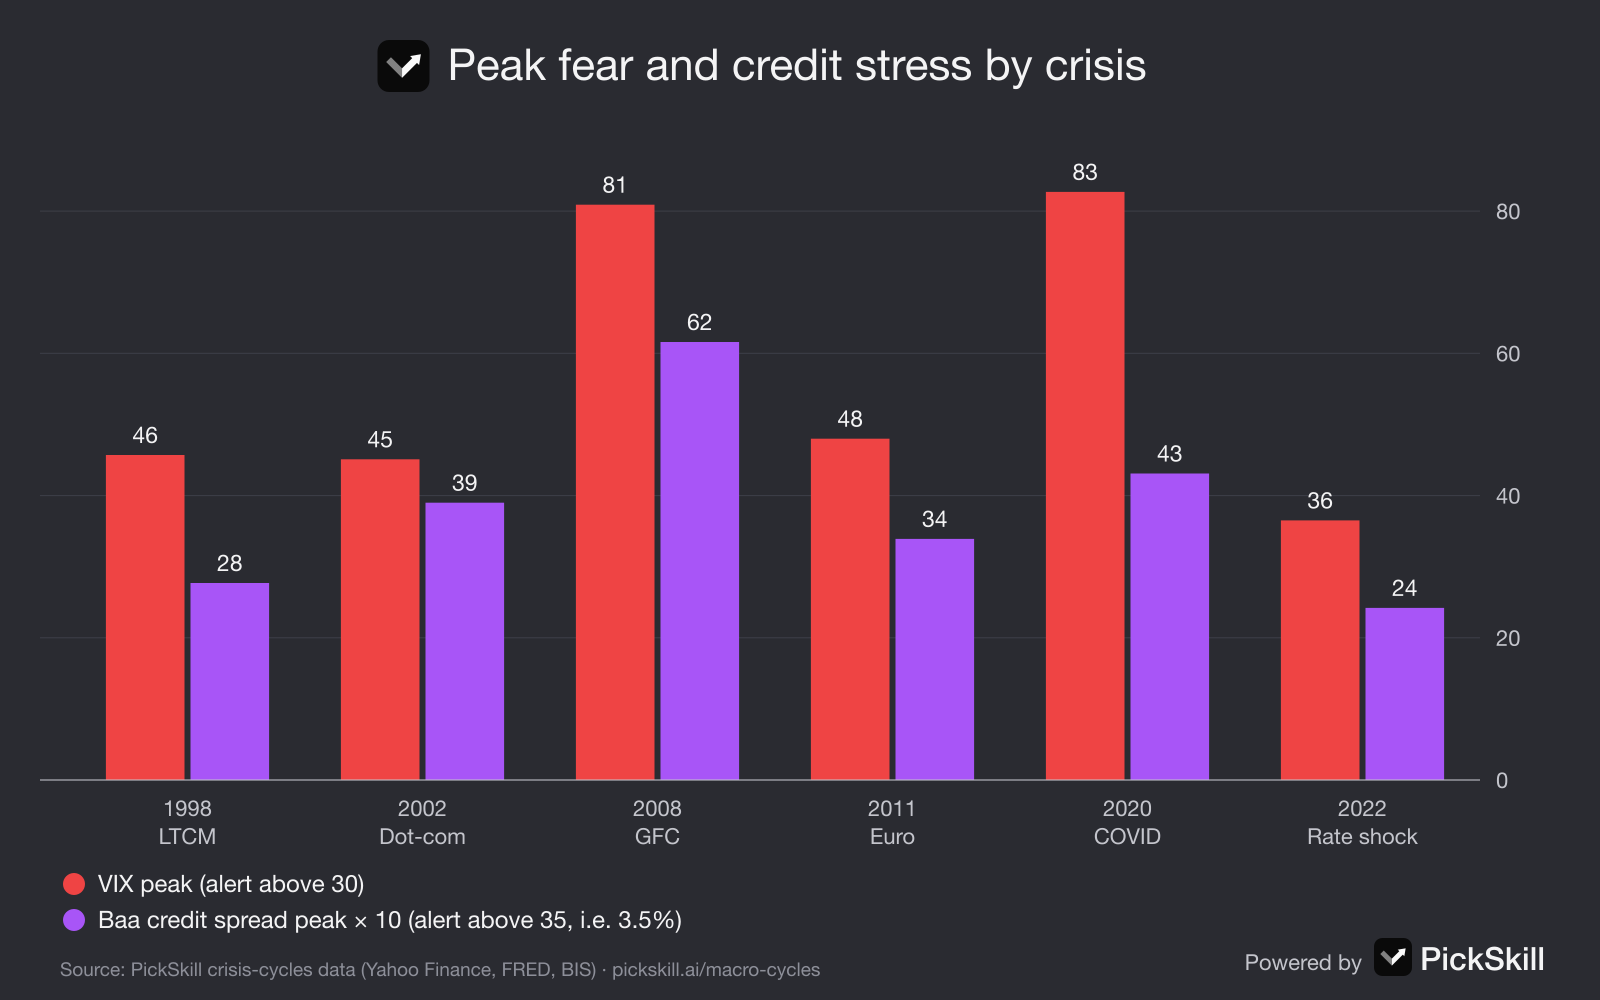
The panic signals are the ones that spike when forced selling starts. PickSkill places them in the first half of a crisis, when cash wins and the first rate cut is not the bottom.
| Signal | What it measures | Watch | Alert | Past peaks |
|---|---|---|---|---|
| VIX | Expected 30-day swings in US stocks | ≥ 20 | ≥ 30 | 80.9 (Nov 2008), 82.7 (Mar 2020) |
| Credit spread | Moody's Baa corporate yield minus 10-year Treasury | ≥ 2.5% | ≥ 3.5% | 6.16% (Dec 2008), 4.31% (Mar 2020) |
| Dollar squeeze | Dollar index change over 3 months | ≥ +3% | ≥ +6% | +24.9% (2008–09), +8.3% in 11 days (2020) |
| Stocks and gold fall together | Worst joint 20-day move in 3 months | both down | S&P ≤ −8% and gold ≤ −5% | Oct–Nov 2008, Mar 2020 |
| S&P 500 drawdown | Distance below the all-time high | ≤ −10% | ≤ −20% | −56.8% (2009), −33.9% (2020) |
Source: PickSkill crisis-cycles data (Cboe VIX and index closes via Yahoo Finance; Moody's and Treasury yields via FRED).
Why do stocks and gold falling together matter?
Because it shows investors selling what they can, not what they want to. Gold usually holds up in a sell-off; when it falls in step with stocks, funds are raising cash to meet margin calls and redemptions. That happened in October–November 2008, when gold dropped 29.7% from its March high, and on 9–18 March 2020, when it fell 11.8%. In both cases it was the climax of the panic, not the start: gold bottomed 116 days and 5 days before stocks. The first of PickSkill's six regularities says exactly this: the first half is a liquidity crisis, the second half is currency debasement. Our article on whether gold goes up in a financial crisis covers the gold side in detail.
Which signal marks the turning point?
The most useful turning-point signal has been the central bank going all in. PickSkill tracks it with the Fed balance sheet over three months, where growth above 5% has meant quantitative easing on a crisis scale, and with the Fed rate cycle, where rates near zero mark rescue mode. The S&P 500 bottomed on 9 March 2009, between the launch and the expansion of QE1, and on 23 March 2020, the day the Fed promised unlimited bond buying. When this signal fires while panic signals are still red, the board reads it as the watershed. Our analysis of the stock market after the first Fed rate cut shows why the first cut alone has not been enough.
What do the warning signs say now?
On data to 13 November 2026 the board's rule-based reading was "no crisis signal". The panic lights were calm: VIX 20.0, Baa credit spread 1.48%, the S&P 500 3.3% below its 6 October 2026 high, and no joint fall in stocks and gold. Two lights were amber. The dollar index had risen 3.8% in three months, and the Fed was in an easing cycle, 145 basis points below its 5.33% peak at 3.88%. The yield curve was positive at +0.27% after its long inversion, which keeps the late-cycle question open. One light was red: Chinese home prices were 6.3% lower than a year earlier, the continuing China property downturn. The gold light was calm: gold was 7.3% lower over twelve months and 26.9% below its January 2026 record, far from the +25% rally that has signalled a rush into gold. You can see every reading and its two-year sparkline on the signal board, or ask PickSkill's AI analyst to explain what today's lights mean for your holdings.
How should you use crisis warning signs?
Use them as a checklist that changes how much risk you take, not as a timing tool. Three rules have held up. First, count the lights: one alert is common; two or more panic signals together has been rare and serious. Second, respect the order: late-cycle signals can run for a year or more, panic signals last weeks to months, and the policy signal marks the turn. Third, match the playbook to the crisis type: in inflation-driven crises like 2022, cash and short bonds won and gold did not lead, as the page's exceptions explain. To act on it in your own portfolio, combine the macro reading with stock-level signals such as moving averages and RSI, which PickSkill computes daily for US, Hong Kong and A-share stocks.
FAQ
What is the best early warning sign of a recession? The yield curve has the best track record: every US recession since 1980 followed a sustained inversion of the 10-year minus 2-year Treasury spread by 6 to 19 months. It is not infallible, so it is best read together with credit spreads and unemployment.
What VIX level signals a crisis? Readings above 30 have marked panic, and above 40 a full-blown crisis. The VIX closed at 80.9 in November 2008 and at a record 82.7 on 16 March 2020. Readings around 20, as in November 2026, are normal.
What credit spread level is dangerous? On the Moody's Baa minus 10-year Treasury spread, readings above 3.5% have meant serious credit stress. It peaked at 6.16% in December 2008 and 4.31% on 23 March 2020, the day the S&P 500 bottomed. It was 1.48% on 12 November 2026.
Why does a strong dollar signal a crisis? In a panic, banks and companies around the world need US dollars to repay dollar debts, so they sell other assets and the dollar jumps. The dollar index rose 24.9% in 2008–09 and 8.3% in eleven days in March 2020.
Are we in a financial crisis now? Not according to PickSkill's rule-based board on data to 13 November 2026, which read "no crisis signal". The VIX, credit spreads and stock drawdown were calm; the dollar and the Fed cycle were amber, and Chinese home prices were in a downturn.