Stock Market After the First Fed Rate Cut: 7 Cycles
When the Fed's first cut came with a recession, the S&P 500 fell another 42–56%. Without one, it rose 18–21% in a year. Data on 7 easing cycles since 1989.

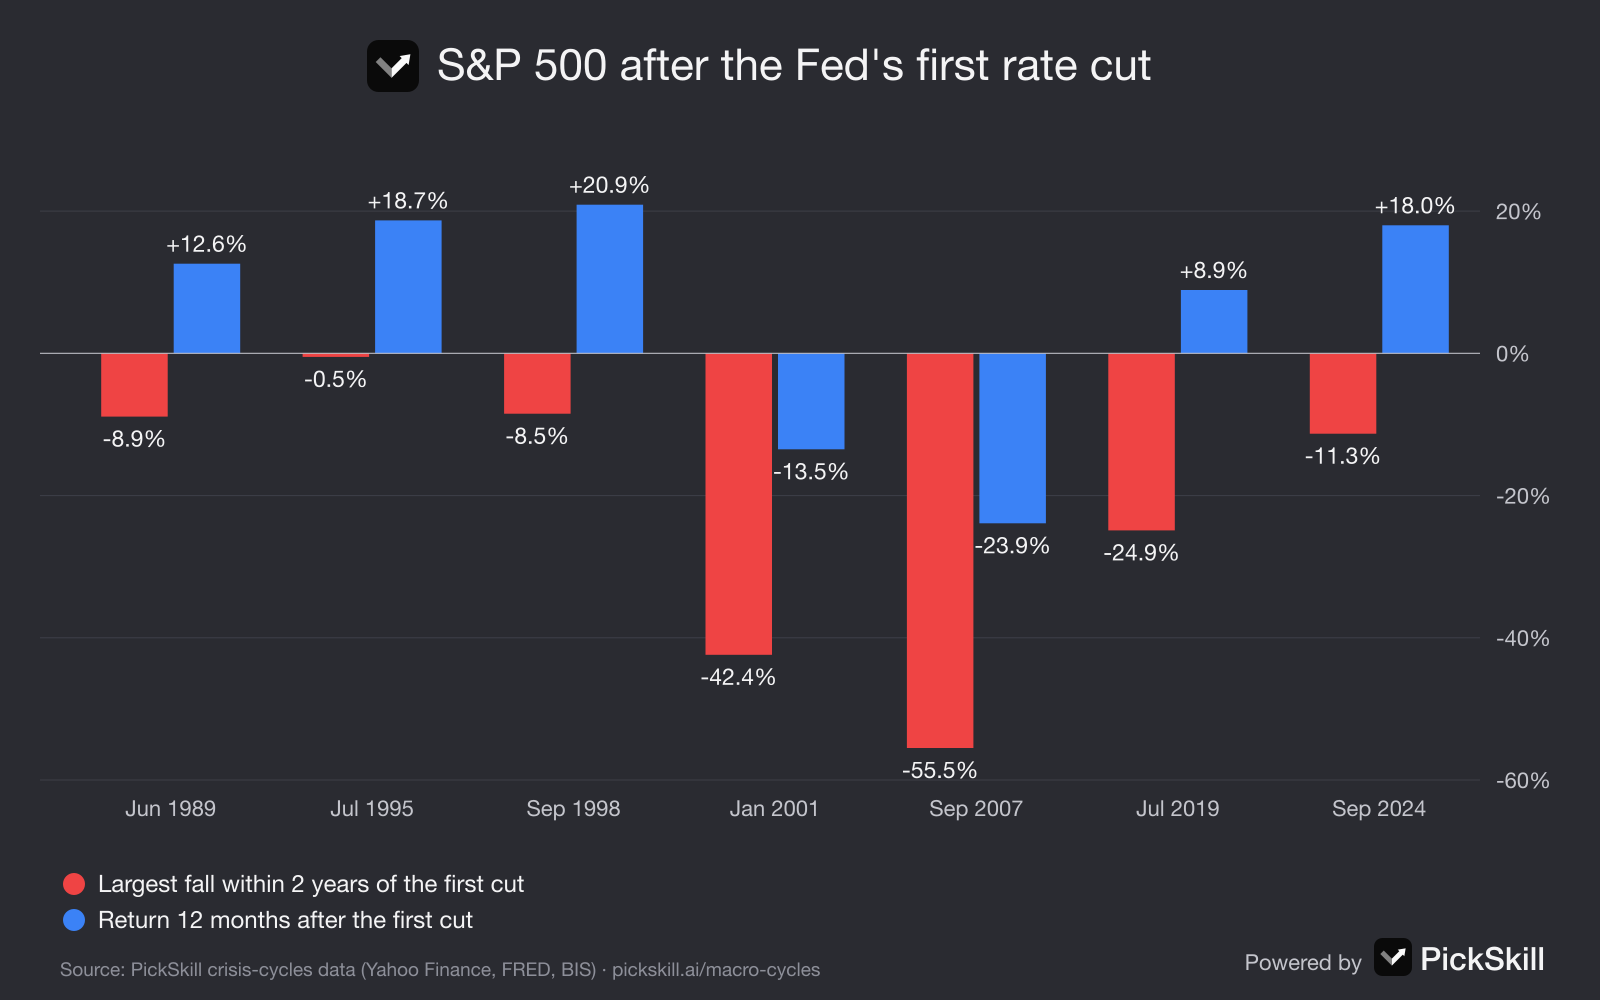
The Federal Reserve's first rate cut is not a reliable signal that stocks have bottomed. When a recession followed, as in 2001 and 2007, the S&P 500 fell another 42% and 56% after the first cut and was lower a year later. When no recession followed, as in 1995, 1998 and 2024, the worst dip was 0.5–11% and stocks were up 18–21% a year later. What decides the outcome is the economy, not the cut. In past crises the more reliable turning point came later, when the central bank went all in with zero rates and money printing.
This analysis uses daily S&P 500 closes and the effective federal funds rate from PickSkill's crisis cycles page. Links point to the crisis, phase or signal on that page that each number comes from.
Key takeaways
- Two outcomes, not one. Recession cycles: −42.4% (2001) and −55.5% (2007) after the first cut. Soft landings: −0.5% (1995), −8.5% (1998), −11.3% (2024).
- The first cut often comes near the top. In 2007 the Fed cut on 18 September; the S&P 500 peaked three weeks later.
- The bottom came with "whatever it takes". QE in 2008–09, unlimited QE on 23 March 2020 (the exact low), a devaluation in 1933.
- The yield curve tells you which outcome is more likely. Every US recession since 1980 came 6–19 months after the curve inverted.
- This cycle so far: the Fed began cutting on 18 September 2024; by 13 November 2026 the S&P 500 was 34.6% higher.
What happens to stocks after the Fed's first rate cut?
It depends on whether a recession follows. The table below lists the first cut of each Fed easing cycle since 1989 and what the S&P 500 did next, measured on daily closes.
| First cut | Recession followed? | Largest S&P 500 fall within 2 years | Low | S&P 500 12 months later |
|---|---|---|---|---|
| 6 Jun 1989 | Yes, from Jul 1990 | −8.9% | Oct 1990 | +12.6% |
| 6 Jul 1995 | No | −0.5% | Jul 1995 | +18.7% |
| 29 Sep 1998 | No | −8.5% | Oct 1998 | +20.9% |
| 3 Jan 2001 | Yes | −42.4% | 9 Oct 2002 | −13.5% |
| 18 Sep 2007 | Yes | −55.5% | 9 Mar 2009 | −23.9% |
| 31 Jul 2019 | Yes, COVID shock | −24.9% | 23 Mar 2020 | +8.9% |
| 18 Sep 2024 | Not so far | −11.3% | 8 Apr 2025 | +18.0% |
Source: PickSkill crisis-cycles data (S&P 500 closes via Yahoo Finance, fed funds via FRED). Falls are measured from the close on the day of the first cut.
Why isn't the first rate cut the bottom?
Because in a real downturn the Fed cuts in response to damage that is still unfolding. Earnings, credit and jobs keep deteriorating for months after the first cut, and stocks follow them down. In the dot-com bust the Fed's emergency cut on 3 January 2001 came ten months after the Nasdaq peak, and the S&P 500 still fell for 21 months more, through 9/11 and the Enron and WorldCom scandals. In the Global Financial Crisis the first cut on 18 September 2007 came three weeks before the market top; the S&P 500 then lost 55.5%. On PickSkill's playbook the first cut belongs to the first half of the crisis, the phase in which cash wins and stocks keep falling. The board's Fed cycle signal is labelled accordingly: first cut is not the bottom; near-zero rates are the watershed.
What has marked the bottom instead?
The bottom has come when policy turned unlimited: rates at or near zero, plus money printing or a government guarantee big enough to stop forced selling. In 2008–09 the Fed announced QE1 on 25 November 2008, cut to zero on 16 December and expanded QE on 18 March 2009; the S&P 500 bottomed on 9 March 2009, in the middle of that sequence. In 2020 the Fed promised unlimited bond buying on 23 March, and that was the exact closing low. In the euro crisis, Mario Draghi's "whatever it takes" on 26 July 2012 ended the panic without the ECB buying a single bond. PickSkill calls this point the watershed, and the second of its six regularities is that the turning point is unlimited support, not the first rate cut. To see the 2008 sequence of cuts and QE against the S&P 500, open the timeline zoomed to 2008.
How can you tell whether a recession will follow?
You cannot know in advance, but a few signals have separated the two outcomes. The first is the yield curve. Each of the six US recessions since 1980 was preceded by a sustained inversion, with 10-year Treasury yields below 2-year yields, starting 6 to 19 months earlier, and the risk window has tended to open when the curve turns positive again. Not every inversion has led to a recession: brief dips in 1998 did not, and the 2022–24 inversion, the longest on record at 784 days, is the open test case. The second is credit: in 2001 and 2008 the gap between corporate and Treasury yields widened sharply after the first cut, while in 1995 and 1998 it calmed quickly. The third is whether the Fed is cutting into rising unemployment or as "insurance". PickSkill's signal board tracks the yield curve and the credit spread daily, and our guide to financial crisis warning signs explains how each one has behaved before past crises.
What does this mean for the current cycle?
As of the data to 13 November 2026, this cycle looks like a soft landing so far. The Fed made its first cut on 18 September 2024 and had lowered rates by 145 basis points, to 3.88%. The S&P 500's worst fall since then was 11.3% in April 2025, and it was 34.6% above its level on the day of the first cut. The yield curve, which was inverted from July 2022 to August 2024, had turned positive at +0.27%, and the credit spread sat at a calm 1.48%. The history above says the period after an inversion ends is still worth watching. To check how your own holdings would cope if this turned into a 2001-style cycle instead, ask PickSkill's AI analyst to stress-test your portfolio against the 2001 and 2007 paths, or read how the technical and fundamental views of a stock can disagree in a downturn.
FAQ
Do stocks go up after the first Fed rate cut? Only when no recession follows. After the first cuts of 1995, 1998 and 2024 the S&P 500 was up 18–21% a year later. After the first cuts of 2001 and 2007, which were followed by recessions, it fell another 42% and 56% and was lower a year later.
How far did stocks fall after the Fed started cutting in 2007? The Fed's first cut came on 18 September 2007. The S&P 500 peaked three weeks later, on 9 October 2007, and bottomed on 9 March 2009, 55.5% below its level on the day of the first cut.
What marked the bottom of the 2008 and 2020 bear markets? In both cases it was the Fed going all in. The S&P 500 bottomed on 9 March 2009, between QE1 (November 2008) and its expansion (18 March 2009), and on 23 March 2020, the day the Fed promised unlimited bond buying.
Is the first rate cut bullish or bearish? Neither on its own. It is bullish when it is "insurance" in a healthy economy and bearish when it is a response to a recession that is already starting. Credit spreads, the yield curve and unemployment have been better guides than the cut itself.
When did the current Fed easing cycle start? The Fed's first cut of the current cycle was on 18 September 2024. By 13 November 2026 it had cut 145 basis points to 3.88%, and the S&P 500 was 34.6% higher than on the day of the first cut.