ADX vs ATR: Trend Strength vs Volatility Explained
ADX vs ATR: what each Wilder indicator measures, the 14-period formulas, ADX 20/25/40 levels, 2×ATR stops, and real NVDA, Tencent and Moutai readings.
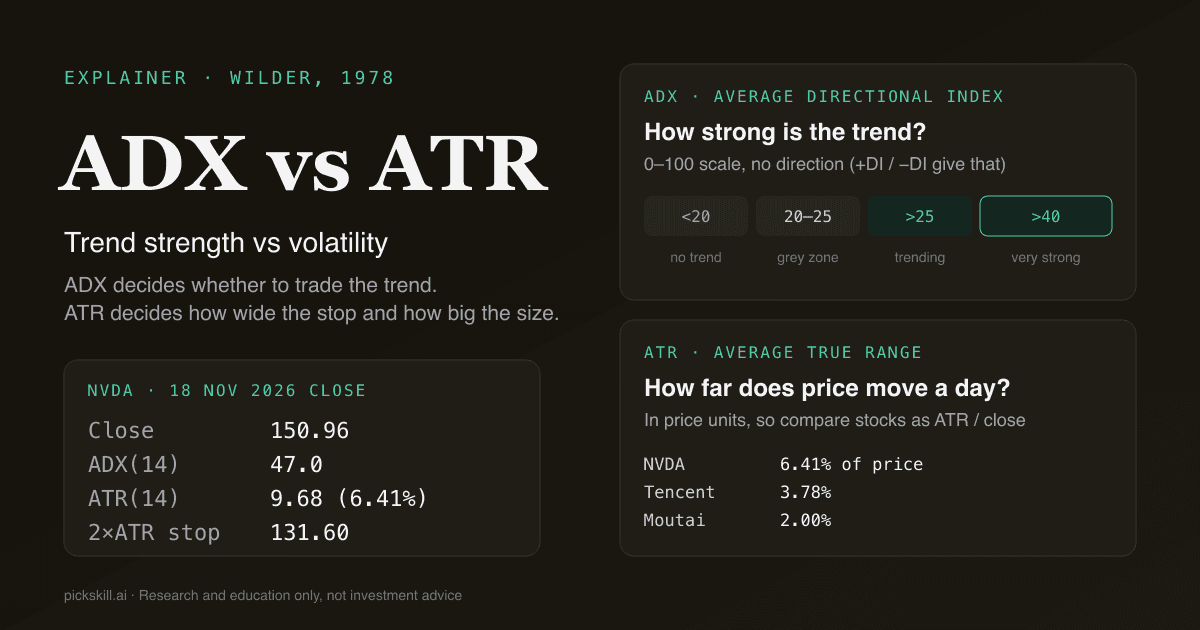
ADX measures how strong a trend is; ATR measures how much a price moves per day. ADX (Average Directional Index) is a 0–100 trend-strength indicator that ignores direction, while ATR (Average True Range) is a volatility indicator expressed in price units. Both come from J. Welles Wilder's 1978 book New Concepts in Technical Trading Systems, and both default to 14 periods. At the 18 Nov 2026 close, NVIDIA had an ADX(14) of 47.0 and an ATR(14) of $9.68, or 6.41% of its $150.96 price, by our own calculation from Yahoo Finance daily bars.
The two are not competitors. ADX answers "is there a trend worth following?" and ATR answers "how much room does this stock need, and how big should my position be?" This guide covers the formulas, the levels people actually use, and a worked example on three stocks from three markets.
Key takeaways
- ADX = trend strength, ATR = volatility. Neither tells you direction. For direction, read ADX's companion lines, +DI and −DI.
- Common ADX levels: below 20 no trend, 20–25 a grey zone, above 25 trending, above 40 very strong. Wilder himself named 25 and 20.
- ATR is in price units, so a $9.68 ATR on NVDA and a ¥29.21 ATR on Kweichow Moutai can't be compared directly. Divide by the close: 6.41% vs 2.00%.
- Used together: ADX decides whether to trade a trend; ATR sets the stop distance (often 2×ATR) and the position size.
- As of 18 Nov 2026, 260 of 503 S&P 500 stocks had ADX(14) above 25 on PickSkill's screener, and 59 were above 40.
What is the difference between ADX and ATR?
The difference between ADX and ATR is what they measure: ADX measures the strength of a trend, and ATR measures the size of price swings. ADX is bounded between 0 and 100 and is unitless, so an ADX of 30 means roughly the same thing on a $20 stock and a $2,000 stock. ATR is an average of daily ranges in the stock's own currency, so it grows with the share price. A stock can be very volatile with no trend at all (high ATR, low ADX), such as a stock whipsawing around earnings. It can also trend smoothly with small daily moves (low ATR, high ADX). That is why traders use them for different jobs rather than picking one. Both share the same building block, the true range, which is one reason they fit together well.
| ADX (Average Directional Index) | ATR (Average True Range) | |
|---|---|---|
| Measures | Trend strength | Volatility (typical daily range) |
| Units | 0–100, unitless | Price units (USD, HKD, CNY…) |
| Direction? | No (use +DI / −DI) | No |
| Default period | 14 | 14 |
| Key readings | <20 no trend, 25+ trending, 40+ very strong | Compare as ATR ÷ close (ATR%) |
| Typical use | Filter: trend-following or range tactics? | Stop distance, position size |
| Origin | Wilder, 1978 | Wilder, 1978 |
For a deeper single-indicator walkthrough, see What is ATR? and What is ADX?.
How are ADX and ATR calculated?
Both start from the true range (TR): the largest of today's high minus low, the absolute gap between today's high and yesterday's close, and the absolute gap between today's low and yesterday's close. Including yesterday's close means gaps count as movement. ATR(14) is simply Wilder's smoothed average of TR: ATR = (previous ATR × 13 + today's TR) ÷ 14. ADX takes more steps, but it reuses the same TR as its denominator, so it describes direction relative to volatility. The definitions below match StockCharts' ChartSchool reference for ATR and for ADX.
- Directional movement. +DM = today's high − yesterday's high; −DM = yesterday's low − today's low. Keep only the larger one if it is positive; set the other to 0.
- Smooth over 14 periods with Wilder's method: TR14, +DM14 and −DM14.
- Directional indicators. +DI = 100 × +DM14 ÷ TR14, and −DI = 100 × −DM14 ÷ TR14.
- DX = 100 × |+DI − −DI| ÷ (+DI + −DI). It measures how lopsided the movement is.
- ADX = Wilder's 14-period smoothing of DX. ADX therefore needs roughly 2 × 14 bars before its first value, and it lags price.
Because DX uses the absolute difference, a strong fall produces a high ADX just as a strong rise does. That is the most common misreading of ADX: a rising ADX does not mean the price is rising.
What ADX and ATR levels matter?
For ADX, the levels most traders use are 20, 25 and 40. Wilder suggested that a strong trend is present above 25 and no trend below 20, leaving 20–25 as a grey zone. Many practitioners treat readings above 40 as a very strong, possibly stretched trend, and watch for ADX to turn down from there as a sign the trend is losing force, not necessarily reversing. PickSkill's ADX/DMI signal uses the 20 line: below 20 it shows neutral, and above 20 it shows bullish when +DI is above −DI and bearish when −DI is above +DI (bucketAdx in our indicator code).
ATR has no universal levels because it is in price units. The useful move is to convert it to ATR% (ATR ÷ close) and compare it with the stock's own history and with peers. Over the past year, NVDA's ATR% ranged from 2.36% to 6.41% with a median of 3.21%, so its current reading is the highest in that window. Moutai's ranged from 1.08% to 2.64%, median 1.94%: its 2.00% today is ordinary.
What do ADX and ATR say about NVDA, Tencent and Moutai right now?
We pulled one year of daily bars for three stocks from Yahoo Finance and computed ADX(14), +DI, −DI and ATR(14) ourselves with Wilder smoothing. Then we cross-checked ADX against PickSkill's live stock pages. The three show three different regimes, which is exactly why the two indicators are better read together.
| Stock (as of close) | Close | ADX(14) | +DI / −DI | ATR(14) | ATR% | Close − 2×ATR |
|---|---|---|---|---|---|---|
| NVDA (18 Nov 2026) | 150.96 USD | 47.0 | 8.7 / 44.5 | 9.68 | 6.41% | 131.60 (−12.8%) |
| Tencent 0700.HK (19 Nov 2026) | 348.40 HKD | 22.3 | 14.7 / 42.4 | 13.18 | 3.78% | 322.04 (−7.6%) |
| Moutai 600519.SS (19 Nov 2026) | 1,460.21 CNY | 36.8 | 30.6 / 14.1 | 29.21 | 2.00% | 1,401.79 (−4.0%) |
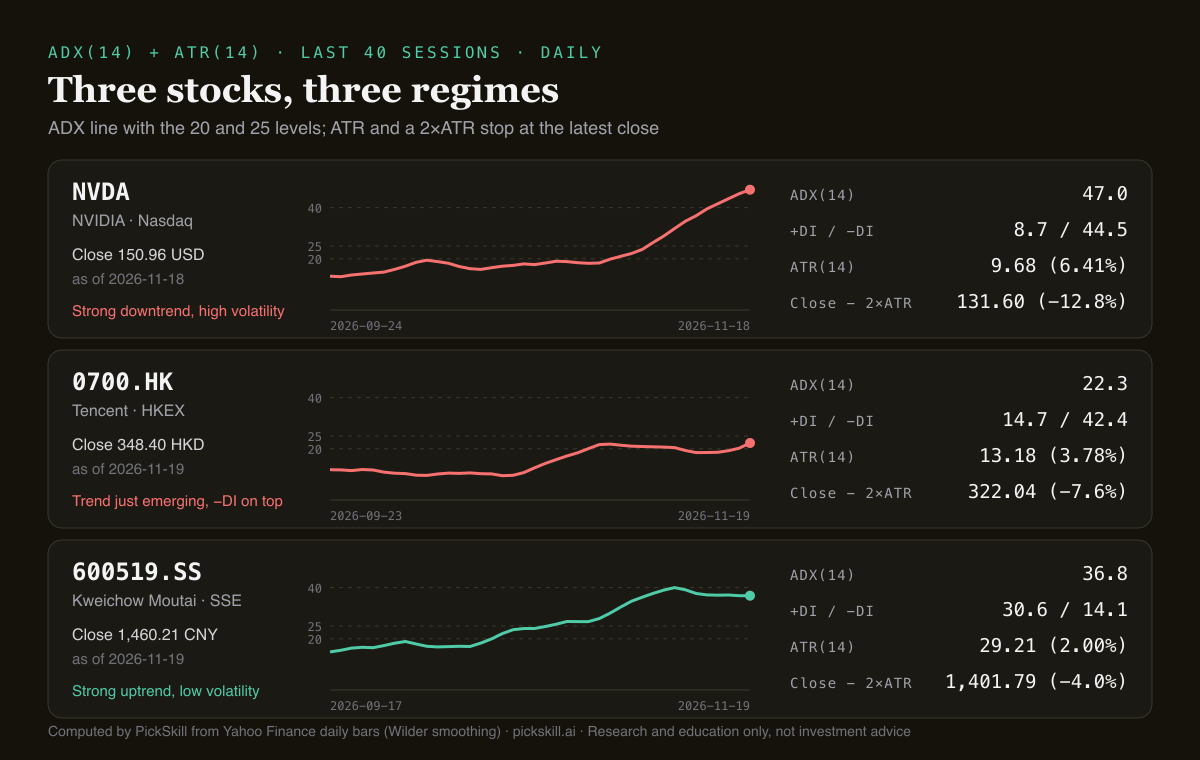
- NVDA: strong downtrend, high volatility. ADX crossed 25 on 5 Nov at a $181.60 close, 24% below the 6 Oct close of $239.24, and passed 40 on 13 Nov. −DI (44.5) dwarfs +DI (8.7). ATR rose from about $6 in October to $9.68. PickSkill's NVDA page shows ADX 47.1 and a bearish ADX/DMI signal on all five days of the trail.
- Tencent: a trend still forming. Since 29 Oct, ADX has hovered between 18.5 and 21.8 while +DI and −DI swapped places twice: the grey zone in action. It crossed back above 20 on 18 Nov, and a 6.55% drop on 19 Nov took it to 22.3 with −DI on top. PickSkill's Tencent page shows ADX 22.1 and the signal turning from neutral to bearish on 18 Nov.
- Moutai: strong uptrend, calm price. ADX crossed 25 on 26 Oct (close ¥1,349.98, 9% above the 29 Sep low) and peaked at 40.0 on 10 Nov. Its ATR% of 2.00% is a third of NVDA's. PickSkill's Moutai page shows ADX 37.1 and bullish all five days.
Our numbers differ from PickSkill's by 0.1–0.3 ADX points. That is expected: Wilder smoothing never fully forgets its starting point, so two correct implementations seeded on different history lengths drift slightly. Direction and level agree in all three cases.
How do you use ADX and ATR together?
The cleanest way to combine them is to give each one a single job: ADX decides whether to treat the stock as trending, and ATR decides how much room and how much money to give the trade. A trend-following entry with ADX below 20 tends to get chopped up. A fixed 5% stop ignores that NVDA's typical day is now 6.41% while Moutai's is 2.00%. A simple workflow:
- Check ADX first. Above 25: trend tactics (pullbacks, breakouts). Below 20: range tactics or no trade. 20–25: wait for confirmation.
- Read +DI and −DI for direction. A high ADX with −DI on top, as on NVDA, is a strong downtrend.
- Set the stop in ATR units. A common choice is 2×ATR from entry. On the 18 Nov close that is 150.96 − 2 × 9.68 = 131.60 for NVDA, 322.04 for Tencent and 1,401.79 for Moutai, for a hypothetical long position. A short position mirrors it above the entry.
- Size from the stop. Shares = money you are willing to lose ÷ stop distance. Per 1,000 units of risk, that is about 51 NVDA shares, 37 Tencent shares or 17 Moutai shares. Tencent and Moutai both trade in board lots of 100 shares, so small accounts may not be able to size them precisely.
- Recheck as ATR changes. NVDA's 2×ATR distance was $12.50 on 22 Oct and $19.36 on 18 Nov. Same rule, very different stop.
This is the logic behind our 3-indicator filter, where ADX is the gate that decides whether MACD and RSI signals deserve trust.
Can ADX or ATR tell you which way the price will go?
No. Neither ADX nor ATR is directional, and both are calculated from past bars, so neither predicts the next move. ADX tells you a trend has been strong; +DI and −DI tell you which way it has been running. ATR tells you how much the stock has been moving, which is useful for risk but says nothing about the next day's direction. Both also lag: by the time NVDA's ADX passed 25, the stock was already 24% off its October high. Treat them as context for decisions, not signals on their own.
Where can you see ADX and ATR for a stock?
Any charting platform can plot both. On PickSkill, every stock page and the indicators page show ADX/DMI(14) with +DI, −DI and a 5-day signal trail, alongside MACD, MA, RSI, KDJ, Bollinger, volume and money flow. The signal screener can filter on adx.adx, adx.plusDi and adx.minusDi, for example "ADX above 25 and ADX/DMI bullish for 3 days". PickSkill does not currently show ATR as a separate card, so compute it in your charting tool or ask the AI analyst to work through a stop and size for you.
Data: Yahoo Finance daily bars, calculations by PickSkill; ADX cross-checked against pickskill.ai stock pages on 19 Nov 2026. Research and education only, not investment advice.
FAQ
Is ADX or ATR better for stop losses? ATR is the one built for stops, because it measures how far a stock typically moves in a day in its own price units. A 2×ATR stop adapts to each stock: on 18 Nov 2026 it was 12.8% below NVDA's close but only 4.0% below Moutai's. ADX does not help size a stop; it tells you whether a trend-following trade is worth taking at all.
What does a high ADX with a high ATR mean? It means a strong trend with large daily swings, the regime NVDA showed in November 2026 (ADX 47.0, ATR 6.41% of price). Trend tactics can work, but stops must be wider and position sizes smaller to keep the same money at risk. High ADX tells you nothing about direction, so check +DI and −DI as well.
Should ADX and ATR use the same period? Wilder used 14 for both, and most platforms default to 14, so starting there keeps them consistent with the true range they share. Shorter settings such as 7 react faster but produce noisier ADX readings and jumpier ATR stops. Longer settings such as 20 or 28 are smoother but lag more. Change one only when you have tested why.
Is a rising ADX bullish? Not by itself. ADX rises when either an uptrend or a downtrend gets stronger, because it uses the absolute gap between +DI and −DI. NVDA's ADX climbed from 13.0 in late September to 47.0 on 18 Nov 2026 while its price fell sharply. Check which DI line is on top before calling a rising ADX bullish.
Why does my ADX value differ from another platform's? Small differences usually come from how much price history is used to seed Wilder's smoothing, and from data adjustments. Our calculation and PickSkill's live pages differed by 0.1–0.3 points on 19 Nov 2026 for NVDA, Tencent and Moutai. Larger gaps usually mean a different period, different smoothing (EMA instead of Wilder) or a different data feed.