Financial Crisis History: Cash, Gold, Homes, Stocks
12 financial crises from 1929 to today, each scored on cash, gold, home prices and stocks — with drawdowns, turning points and the pattern they share.

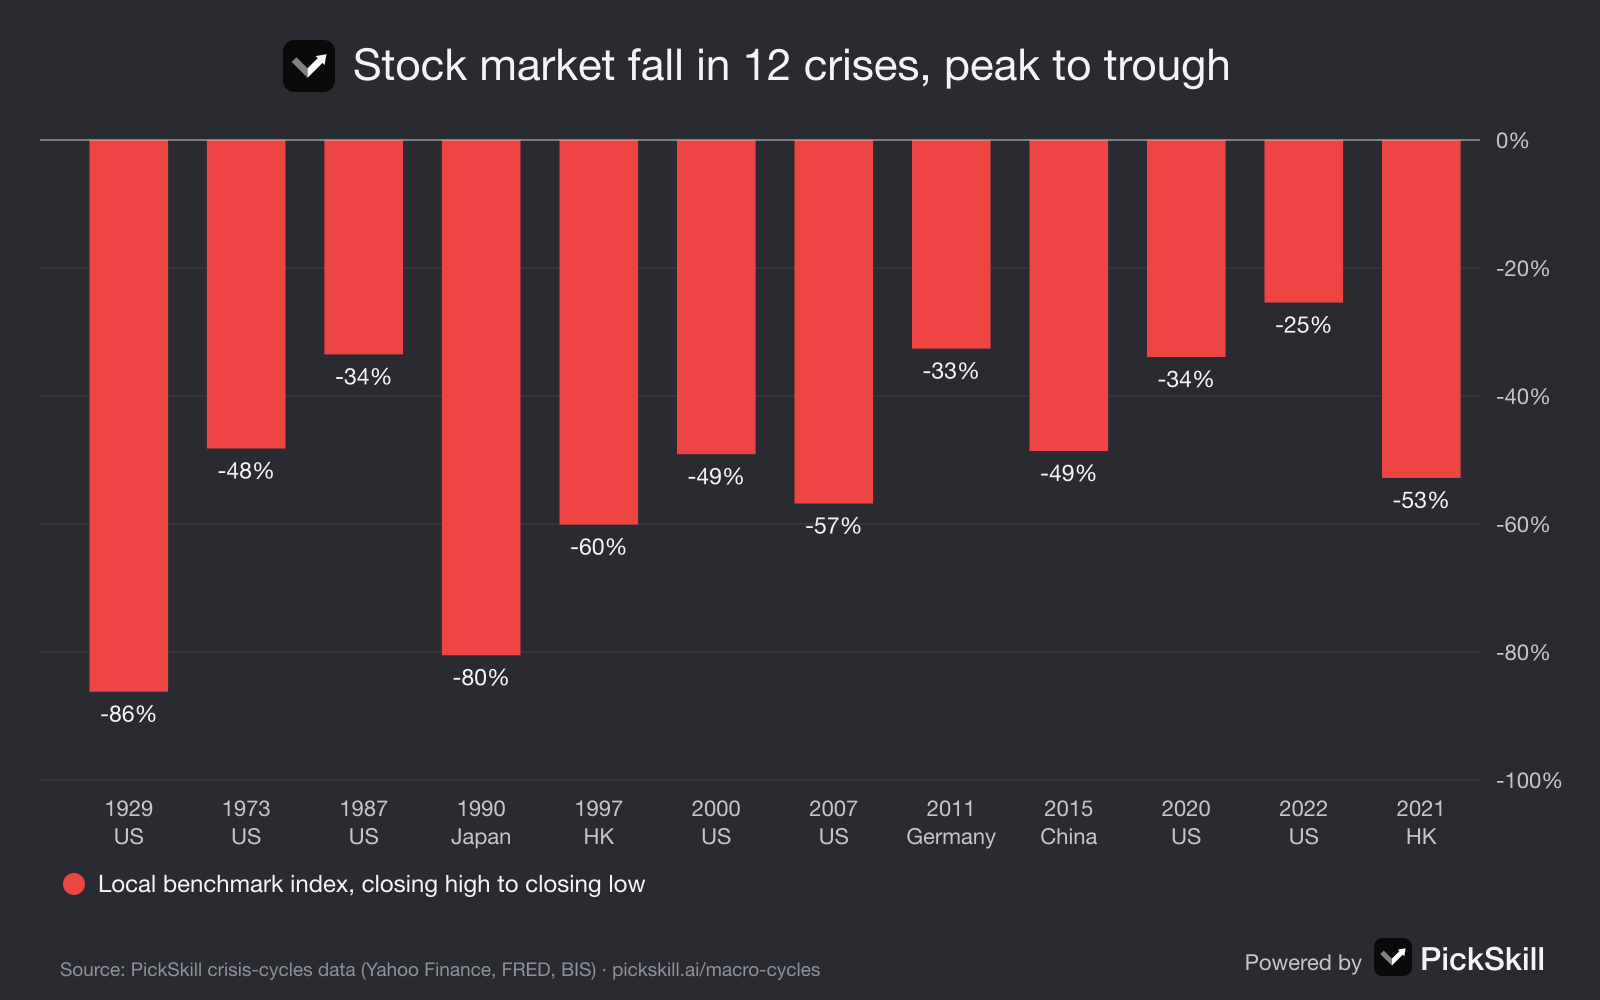
Across twelve major financial crises since 1929, the same sequence keeps repeating: cash wins the panic, gold bottoms first and leads the recovery once central banks print money, stocks bottom next, and home prices bottom last, sometimes a decade later. Local stock markets fell between 25% and 86% from peak to trough. The exceptions are just as consistent. Inflationary crises (the 1970s, 2022) reward cash and punish bonds, and when a central bank will not print (Japan after 1990) there is no recovery phase for years.
This article is the companion to PickSkill's crisis cycles page, which puts every one of these crises on a single daily timeline of cash, gold, housing and stocks. Each crisis below links to its full write-up on that page.
Key takeaways
- Twelve crises, one shape: a first half of forced selling, a watershed when policy goes unlimited, a second half of reflation.
- Average local stock fall: about 50%. Worst: 1929 (−86%) and Japan 1990 (−80%). Mildest: 2022 (−25%).
- Gold bottomed before stocks in the debt crises of 2000, 2008, 2015 and 2020, and after them in the 2022 tightening crisis.
- Housing was the slowest asset whenever property was the epicentre: 6 years in Hong Kong, 5.6 in the US, 18 in Japan.
- Cash was best in deflation and worst in inflation, and only reserve-currency cash was safe.
Which financial crises are in the dataset?
The dataset covers twelve crises chosen because each moved at least one of the four assets in a way that changed how investors think about them. Stock falls are peak-to-trough on daily closes of the local benchmark.
| Crisis | Years | Type | Local stocks | Cash | Gold | Housing | Stocks |
|---|---|---|---|---|---|---|---|
| Great Depression | 1929–33 | Debt deflation | S&P 500 −86% | Best | Good | Poor | Worst |
| 1970s stagflation | 1973–82 | Inflation | S&P 500 −48% | Worst | Best | Good | Poor |
| Black Monday | 1987 | Market crash | S&P 500 −34% | Good | Good | Mixed | Worst |
| Japan's bubble | 1990–2012 | Balance-sheet recession | Nikkei −80% | Best | Mixed | Worst | Worst |
| Asian crisis & LTCM | 1997–98 | Currency crisis | Hang Seng −60% | Mixed | Mixed | Worst | Worst |
| Dot-com bust | 2000–02 | Equity bubble | S&P 500 −49% | Good | Best | Best | Worst |
| Global Financial Crisis | 2007–09 | Credit crisis | S&P 500 −57% | Best | Good | Worst | Worst |
| Euro debt crisis | 2010–12 | Sovereign debt | DAX −33% | Mixed | Good | Poor | Poor |
| China crash | 2015–16 | Margin bubble | Shanghai −49% | Good | Best | Best | Worst |
| COVID crash | 2020 | Exogenous shock | S&P 500 −34% | Good | Best | Best | Mixed |
| Inflation shock | 2022–23 | Tightening | S&P 500 −25% | Best | Good | Mixed | Poor |
| China property | 2021– | Property deleveraging | Hang Seng −53% | Good | Best | Worst | Poor |
Source: PickSkill crisis-cycles data (index closes via Yahoo Finance; housing via Case-Shiller and BIS; cash via US CPI). Ratings compare the four assets within each crisis.
What pattern do financial crises share?
Most crises run in three stages, which PickSkill calls the first half, the watershed and the second half. In the first half, debt has to be repaid or rolled over in a hurry, so everything is sold for cash: stocks, property, credit and even gold. The watershed is the day policy turns unlimited, as with QE in 2008–09, unlimited QE on 23 March 2020 or the dollar's devaluation in 1933. In the second half new money flows back into assets in a fairly fixed order: gold first, stocks next, housing last. The page condenses this into six regularities, from "the turning point is unlimited support, not the first rate cut" to "gold's enemy is rising real rates".
Which crises broke the pattern?
Three kinds of crisis have broken it, and they are worth knowing because they reverse the advice. Inflationary crises, the 1970s and 2022, began with too much money rather than too little; cash lost value in the 1970s, stocks and bonds fell together in 2022, and the turn came when inflation peaked, not when rates were cut. A central bank that would not print: Japan after 1990 waited nine years for zero rates and eleven for QE, and spent two decades in deflation. A crash without a credit crisis: 1987 erased 34% in weeks but, with no recession, the market made new highs within two years. The page lists these under when the playbook breaks.
How did each asset do across all twelve crises?
Each asset had a clear job in the cycle. Cash was the best asset in four crises, all deflationary or tightening ones (1929, Japan 1990, 2008 and 2022), was the only safe asset in 1997 if it was in dollars, and was the worst in the inflationary 1970s; see is cash king in a recession. Gold was the best or a good asset in ten of twelve, usually by bottoming early and leading the recovery; see does gold go up in a financial crisis. Housing was either the worst asset, when it was the epicentre, or among the best, when lower rates flowed into it; see when do house prices bottom after a crash. Stocks were the worst or a poor asset in eleven of twelve during the crisis itself, but recovered fastest once the watershed passed.
How can you study a crisis in more detail?
Open the crisis on PickSkill's timeline, which shows cash, gold, home prices, stocks, rates and stress gauges on one time axis, with each crisis's phases shaded and its key events flagged. You can jump straight to a crisis with a link such as the 2008 crisis on the timeline and compare all twelve stock-market paths aligned at their peaks in the crisis comparison chart. To apply a historical crisis to your own holdings, ask PickSkill's AI analyst to replay your portfolio through any of them, or read how the crisis warning signs look today.
FAQ
What was the worst stock market crash in history? For a major market, the 1929–32 crash: the S&P 500 fell 86% from September 1929 to June 1932. Japan's Nikkei fell 80% from its December 1989 peak to April 2003 and did not regain that peak until February 2024.
How many financial crises have there been since 1929? There have been many local crises; PickSkill's dataset covers twelve that changed how cash, gold, housing and stocks behave: 1929, the 1970s, 1987, Japan 1990, Asia 1997, 2000, 2008, the euro crisis, China 2015, 2020, 2022 and China's property downturn from 2021.
Which asset performed best in financial crises? It depends on the type of crisis. Cash was best in deflationary panics such as 1929 and 2008, gold in inflationary or money-printing phases such as the 1970s and 2020, and housing when it was not the cause of the crisis.
Do all financial crises follow the same pattern? Most debt-driven crises follow the same order: a cash panic, a policy watershed, then a recovery led by gold and stocks with housing last. Inflationary crises, crises without money printing and crashes without a credit problem are the main exceptions.
How long do financial crises last? Stock-market declines lasted from 33 days (2020) to about 13 years (Japan). Housing downturns have lasted longest: 5 to 6 years in the US and Hong Kong and about 18 years in Japan.