5 AI Models Analysed NVDA: Where They Disagreed
DeepSeek, Qwen, Kimi, GLM and MiniMax read the same NVDA fact sheet twice on one day. One run said bearish, the other split. Stances, levels and why.
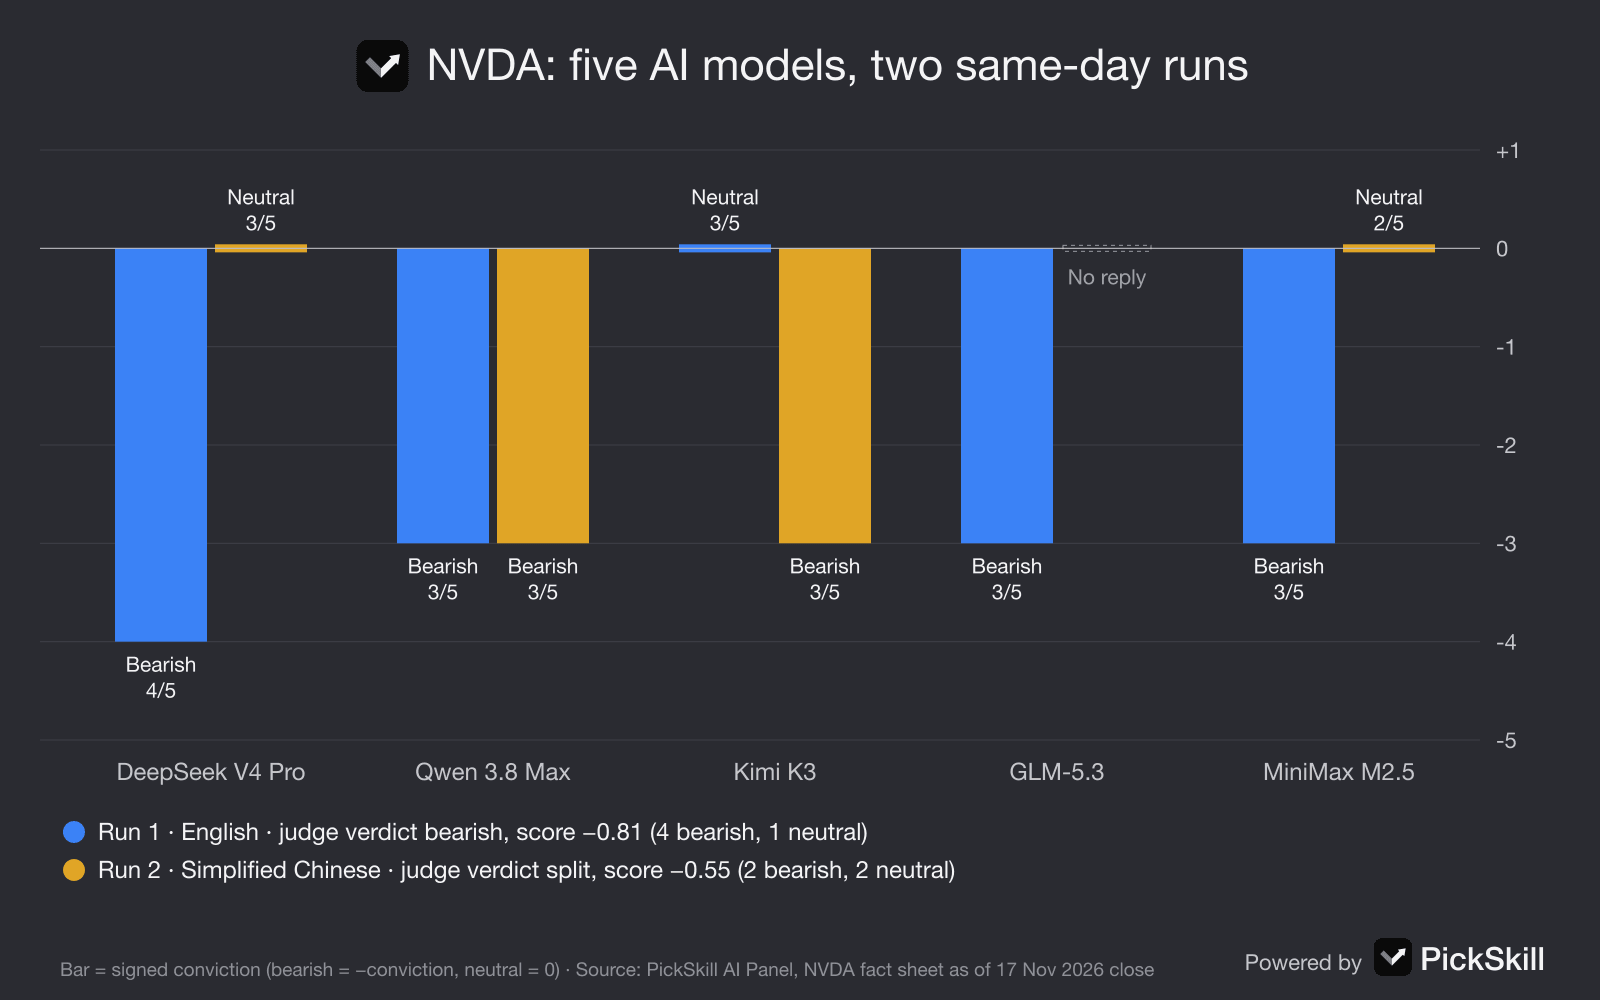
Five AI models mostly leaned bearish on NVIDIA (NVDA) in the short term, but they did not agree on what to do about it. An AI stock panel is a set of language models that read the same data, give separate views, and have a judge combine them. In our English run on the 17 Nov 2026 close ($155.46), four of five models were bearish and the judge scored the panel −0.81 on a −1 to +1 scale. A second run on the same data, in Chinese, came back "split".
Both runs used PickSkill's AI Panel and the same fact sheet. The gap between them is the most useful finding here. It shows how much one AI opinion on a stock can change from run to run.
Key takeaways
- All the models saw the same setup: a strong downtrend (ADX 45.5, price below the 5-, 20- and 60-day averages) plus a deeply oversold reading (RSI 22.52).
- English run: 4 bearish, 1 neutral (Kimi K3). Verdict bearish, confidence 4/5, no new long positions, invalidation at 162.87.
- Chinese run: 2 bearish, 2 neutral, and GLM-5.3 returned no usable view. Verdict split, confidence 3/5, small test buys allowed at 148.35–155.46.
- Three of the five models changed stance between runs. Only Qwen 3.8 Max gave the same stance both times.
- NVIDIA reported Q3 FY2027 results after the bell on 17 Nov 2026. So the $155.46 close came before the market reacted, but the fact sheet already included the earnings beat. Several models misread that timing.
What did the five AI models say about NVDA?
The panel's view of NVDA was bearish on balance, with a horizon of weeks for every model. All of them read one fact sheet, dated as of the 17 Nov 2026 close:
- Price: $155.46, down 0.44% on the day, 7.95% over five days and about 28% over 20 days. That close was also the lowest close of the past 60 days.
- Trend: the close sat under the 5-, 20- and 60-day moving averages at 162.87, 192.59 and 213.39. ADX was 45.5, with −DI at 47.76 against +DI at 8.1.
- Volume: the volume ratio was 1.72, and money flow had been negative for five straight sessions.
- Oscillators: RSI(14) was 22.52 and KDJ was near 16.
- Support: the lower Bollinger band was at 148.35 and the 52-week low at 148.8.
- Earnings: the latest quarter showed EPS of $2.68 against an estimate of $2.47, an 8.5% beat.
This is the English run in full. On this panel, "bearish" means reduce or avoid a position. It never means short the stock.
| Model | Stance | Conviction | Entry zone | Stop / invalidation | Targets |
|---|---|---|---|---|---|
| DeepSeek V4 Pro | Bearish | 4/5 | — | 162.87 | 148.35 |
| Qwen 3.8 Max | Bearish | 3/5 | — | 192.59 | 148.35 |
| Kimi K3 | Neutral | 3/5 | 148.35–155.46 | 148.35 | 162.87, 192.59 |
| GLM-5.3 | Bearish | 3/5 | — | 192.59 | 148.8, 148.35 |
| MiniMax M2.5 | Bearish | 3/5 | — | 162.87 | 148.35, 140 |
| Judge (DeepSeek V4 Pro) | Bearish | 4/5 confidence | — | 162.87 | 148.35, 140 |
The tally score is conviction-weighted: bearish votes count as minus their conviction, neutral as zero, divided by total conviction. Here that is −(4+3+3+3) / 16 = −0.81.
Where did the AI models agree on NVIDIA?
All five models agreed that the trend was strongly down, and none of them was bullish. The judge listed four points of agreement:
- The 155.46 close was a new 60-day closing low.
- All three moving averages were falling, and the price was well below each of them.
- ADX and the directional lines showed heavy selling pressure with no sign of a turn.
- Money flow had been deeply negative for five straight days.
The models also listed the same main risk to their view: a sharp bounce. Every model flagged the oversold readings (RSI 22.52, K/D/J near 16) as something that could lift the price quickly. Most also mentioned the cheap valuation in the fact sheet, including a forward P/E of 9.09 and a PEG of 0.15.
DeepSeek V4 Pro put the bearish case simply: "ADX at 45.5 and −DI at 47.76 far above +DI (8.1) confirm huge bearish momentum." For background, read what RSI measures, how ADX rates trend strength and why MACD and RSI can point different ways.
Where did the models disagree?
The models disagreed in two places: whether buying near support made sense, and which price level would prove the bearish view wrong.
Buy, or wait? In the English run, Kimi K3 was the only neutral model. It suggested buying slowly into the 148.35–155.46 zone, which sits between the lower Bollinger band and the current close. It would exit on a clear close below that zone and sell into the moving averages above. The other four models said not to add, and to use any rally to cut exposure.
Where is the bearish view wrong? DeepSeek V4 Pro and MiniMax M2.5 set the line at 162.87, the 5-day average. Qwen 3.8 Max and GLM-5.3 used 192.59, the 20-day average. That is a big gap. A bounce of about 5% would end the first pair's bearish view, while the second pair would need about 24%.
A shared "bearish" label can hide very different plans. For more on these levels, see support and resistance explained.
Why did two AI runs on the same day reach different verdicts?
The two runs used the same fact sheet, the same models and the same judge. They still produced different answers. The English run returned a bearish verdict with confidence 4/5 and a score of −0.81. The Chinese run returned a split verdict with confidence 3/5 and a score of −0.55. Its combined plan allowed small test buys at 148.35–155.46 with a stop at 148, while the English plan said to avoid new long positions.
Here is how each model's stance changed between the runs:
| Model | English run | Chinese run |
|---|---|---|
| DeepSeek V4 Pro | Bearish 4/5 | Neutral 3/5 |
| Qwen 3.8 Max | Bearish 3/5 | Bearish 3/5 |
| Kimi K3 | Neutral 3/5 | Bearish 3/5 |
| GLM-5.3 | Bearish 3/5 | No usable view |
| MiniMax M2.5 | Bearish 3/5 | Neutral 2/5 |
Four things explain the gap:
- Sampling variance. Language models do not give the same output every time. On a stock where the trend and the oscillators point in opposite directions, a small change in wording can tip a model from bearish to neutral. Kimi K3 and DeepSeek V4 Pro switched sides in opposite directions.
- The language of the run. The Chinese prompt and answers framed things differently. In Chinese, DeepSeek leaned on the KDJ low-level cross and the lower band as support. In English, it leaned on ADX and money flow. We cannot separate the effect of language from plain randomness with only two runs.
- A missing panellist. GLM-5.3 did not return a usable view in the Chinese run, so only four views were counted. In the English run, GLM was a bearish vote. Without it, the Chinese run was a 2–2 tie, and a tie makes a "split" verdict much more likely.
- The judge's choice. The judge weighs arguments, not just votes. With a 2–2 tie and a −0.55 score, DeepSeek V4 Pro chose "split" rather than "bearish". It then wrote a plan that looked for a short-term bounce at support.
Two runs on one stock cannot tell us how often runs disagree in general. They do show that one panel verdict is not a fixed answer.
Were the AI runs before or after NVIDIA's earnings?
The runs used price data from before NVIDIA's earnings, but the earnings figures were already in the fact sheet. NVIDIA reported results for the third quarter of fiscal 2027 on Tuesday, 17 Nov 2026, at about 1:20 p.m. PT, after the US market closed. Its press release reported:
- revenue of $115.8 billion, up 103% from a year earlier
- Data Center revenue of $107.6 billion
- non-GAAP EPS of $2.68
- a Q4 revenue outlook of $130.0 billion, plus or minus 3%
The release is also filed with the SEC.
This timing matters. The 0.44% drop to $155.46 happened during regular trading, before the report came out. Even so, several models wrote that the stock "fell despite the beat". GLM-5.3, Kimi K3 and DeepSeek V4 Pro did this in English, and Qwen and Kimi did it in Chinese. They treated it as proof of selling pressure. That reasoning is wrong, because the price had not yet reacted to the news.
The panel ran early on 19 Nov (UTC), but its fact sheet stopped at the 17 Nov close, so post-report trading is not covered here. Check the NVDA stock page for the latest signals.
How should you use AI opinions on a stock like NVDA?
Use an AI panel to map the arguments for and against a stock, not to get an answer. Here, the useful output was not "bearish" or "split". It was the shared list of facts, the two levels that decide the trade (148.35 below and 162.87 above), and the clear tension between a strong downtrend and an oversold bounce.
A practical routine:
- Look at the spread, not just the verdict. A 4–1 panel at conviction 3 is weaker than it sounds. A run that flips to split on the same data is telling you that you are looking at a close call.
- Run it again, or in a second language. If the verdict changes, treat the question as open. Same-day results are cached, so you can reopen a run you already paid for at no cost.
- Check timing claims. Compare the as-of date with the earnings date. Most of the "ignored good news" story here came from a timing mistake.
- Write down the levels. Note the invalidation levels (162.87 vs 192.59) and the support shelf (148.35–148.8). Then compare them with your own chart and the stock's signals.
- Decide your own position size. None of the models knows your cost basis, time frame or how much risk you can take.
On PickSkill, the AI Panel runs these five models against one fact sheet, and DeepSeek V4 Pro acts as the judge. The Free plan includes one run a month, and Pro includes 50 runs a month (pricing). For an earlier fundamental view of the same company, see our NVDA bull case write-up.
FAQ
What do AI models say about NVIDIA stock right now? On the fact sheet as of the 17 Nov 2026 close ($155.46), most models on PickSkill's panel leaned bearish over a few weeks. They pointed to a strong downtrend (ADX 45.5, price below all key averages) while warning that RSI 22.52 left room for a sharp bounce. One run's verdict was bearish, and a second run on the same data was split.
Is DeepSeek bullish or bearish on NVDA? It depended on the run. In the English run, DeepSeek V4 Pro was bearish with conviction 4/5 and an invalidation level at 162.87. In the Chinese run on the same data, it was neutral at 3/5 and suggested a small test position at 148.35–155.46 with a stop at 148.35. That flip is a good reason not to rely on any single AI answer.
Why do AI stock analyses give different answers for the same stock? Language models produce varied output, so mixed setups such as a strong downtrend combined with oversold oscillators can land either way. The language of the prompt, a model failing to reply, and how a judge weighs a tie also matter. In our NVDA runs, three of five models changed stance between two same-day runs.
Did the AI panel account for NVIDIA's Q3 FY2027 earnings? Partly. The fact sheet had the EPS beat ($2.68 vs $2.47 estimate), but its price stopped at the 17 Nov close. NVIDIA reported after that close, so the price did not yet show any reaction. Several models wrongly read the 0.44% drop that day as the stock falling on good news.
Can I run the same AI panel on another stock? Yes. PickSkill's AI Panel covers US, Hong Kong, China A-share, Japanese and Korean stocks. Five models give stance, conviction, horizon, reasons, risks and levels from one fact sheet, and a judge writes the verdict. The Free plan includes one run a month, and Pro includes 50 runs a month.
Data as of the 17 Nov 2026 close; panel runs made 19 Nov 2026 (UTC). Research and education only, not investment advice.