MACD vs KDJ: Which Is Better and How to Combine Them
MACD vs KDJ side by side: formulas, speed, false signals, when to use each, and a real screen of how rarely both turn bullish within 3 days.
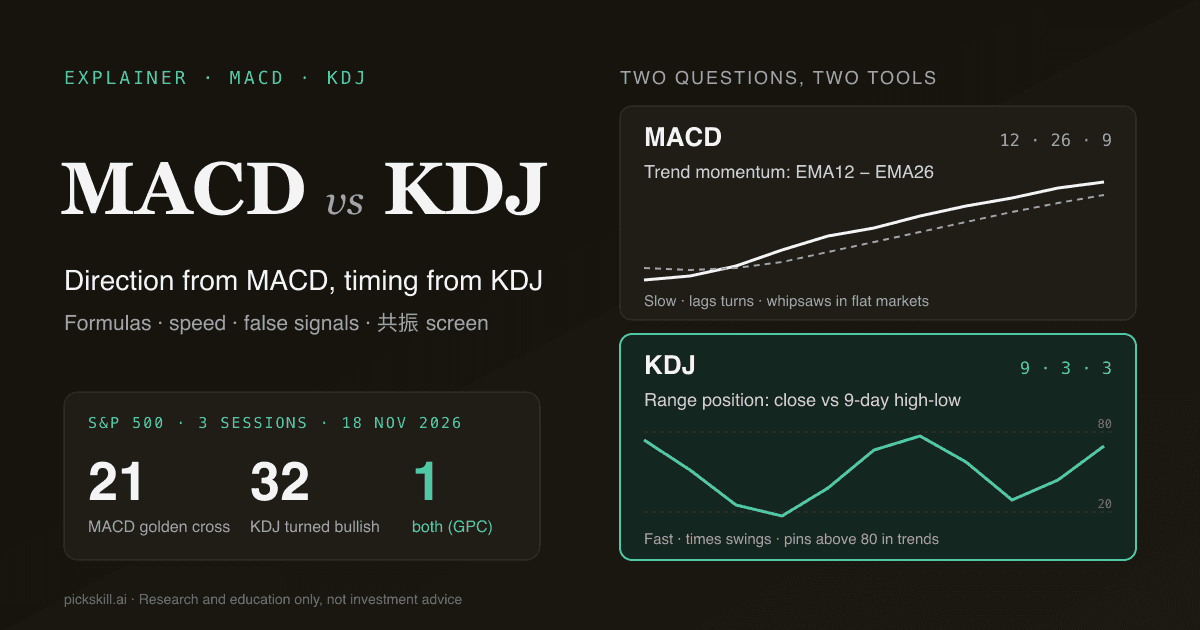
Neither indicator is better on its own: MACD tells you the direction and strength of the trend, KDJ tells you whether price is stretched inside its recent range, so most traders use MACD for direction and KDJ for timing. MACD vs KDJ is the comparison between a slow trend-momentum indicator built from moving averages (12/26/9) and a fast range oscillator built from the 9-day high-low range (9,3,3). In a PickSkill screen of the S&P 500 as of the 18 Nov 2026 close, 21 stocks had a MACD golden cross within 3 sessions and 32 had KDJ turn bullish, but only 1 had both.
That small overlap is the most useful thing in this post. The two indicators rarely agree on the same day, which is exactly why a "共振" (both turning together) reading is treated as a stronger signal in China, where KDJ is a default panel in almost every trading app.
Key takeaways
- MACD measures the gap between a 12-day and a 26-day EMA; it follows trends and lags turns. KDJ measures where today's close sits in the 9-day high-low range; it reacts within days and whipsaws in trends.
- MACD fails in sideways markets (repeated crosses around zero). KDJ fails in strong trends (it pins above 80 or below 20, known as passivation or 钝化).
- In real data, overlap is rare: 1 of 503 S&P 500 stocks (as of 18 Nov 2026) and 2 of 300 CSI 300 stocks (as of 19 Nov 2026) had a MACD golden cross and a KDJ bullish turn within the same 3 sessions.
- A practical split: let MACD (or its zero line) set the direction, and use KDJ crosses only in that direction to time entries and exits.
What is the difference between MACD and KDJ?
MACD and KDJ answer different questions. MACD (Moving Average Convergence Divergence), developed by Gerald Appel in the late 1970s according to StockCharts ChartSchool, asks "is short-term trend momentum accelerating or fading?" It is unbounded and centred on a zero line. KDJ is a Chinese-market extension of George Lane's stochastic oscillator from the late 1950s (ChartSchool). It asks "where did today close inside the last 9 days' range?" and it adds a third line, J, that exaggerates K's moves. For a deeper single-indicator primer, see What Is MACD? and What Is KDJ?.
| MACD (12, 26, 9) | KDJ (9, 3, 3) | |
|---|---|---|
| Type | Trend-following momentum | Range-position oscillator |
| Input | Closing prices | High, low and close |
| Core lines | DIF = EMA12 − EMA26; DEA = 9-day EMA of DIF; histogram | RSV over 9 days; K, D (3-period smoothing); J = 3K − 2D |
| Range | Unbounded, centred on 0 | K and D 0–100; J can exceed 0–100 |
| Key levels | Zero line; DIF/DEA cross | 80 overbought, 20 oversold; K/D cross |
| Speed | Slow; lags turns by days | Fast; reacts within 1–3 sessions |
| Typical false signal | Whipsaw crosses in a flat market | Passivation (stuck above 80 / below 20) in a trend |
| Best regime | Trending markets | Range-bound markets |
| Main job | Direction and trend strength | Entry and exit timing |
How are MACD and KDJ calculated?
MACD starts with two exponential moving averages of the close. DIF is the 12-day EMA minus the 26-day EMA; DEA (the "signal line" in English charting) is a 9-day EMA of DIF. A golden cross is DIF rising through DEA. Chinese charting apps draw the histogram as 2 × (DIF − DEA), while most Western platforms plot DIF − DEA, so bar heights differ by a factor of two; the crossover dates do not. PickSkill uses the 2× convention.
KDJ starts with RSV, the raw stochastic value: (close − lowest low of 9 days) ÷ (highest high of 9 days − lowest low of 9 days) × 100. K is a smoothed RSV: K = ⅔ × yesterday's K + ⅓ × RSV. D smooths K the same way, and J = 3K − 2D. The "3, 3" refers to those two smoothing steps. A KDJ golden cross is K crossing above D; it is taken more seriously when it happens below 20–50 rather than near 80.
Which is faster, MACD or KDJ?
KDJ is faster, by design. Its lookback is 9 sessions and it reads intraday highs and lows, so one strong day can move RSV from 20 to 80. MACD needs the 12-day EMA to pull away from the 26-day EMA, and then DIF has to clear its own 9-day average, so a cross typically arrives several sessions after the price low. KDJ catches the first bounce in a range, but in a downtrend it can give three or four golden crosses before the real bottom. MACD gives fewer crosses, but by the time it confirms, part of the move is already gone. The same speed-versus-reliability theme comes up in KDJ vs RSI and MACD vs RSI.
What false signals does each indicator give?
Each indicator fails in the other's best environment. MACD's typical failure is the sideways whipsaw: when price drifts in a range, DIF and DEA hug the zero line and cross back and forth, each cross looking like a new trend that never comes. A golden cross far below zero after a long decline is also often only a relief rally. KDJ's typical failure is passivation (钝化): in a strong uptrend K and D can sit above 80 for weeks, so "overbought, sell" signals keep firing while price keeps rising, and the reverse happens in a crash. The practical fix is that KDJ readings need a trend filter. For MACD, the matching filter is a volatility or range check, such as requiring a trend-strength reading before trusting a cross.
How rare is it for MACD and KDJ to turn bullish together?
We ran the PickSkill signal screener on two index universes with three queries each: a MACD golden cross within the last 3 trading days, a KDJ "turned bullish" event within 3 days, and both together. In PickSkill's engine, KDJ reads bullish on a K/D golden cross with K below 50, or when K and D are both below 20, and the event requires the reading to still be bullish on the as-of date.
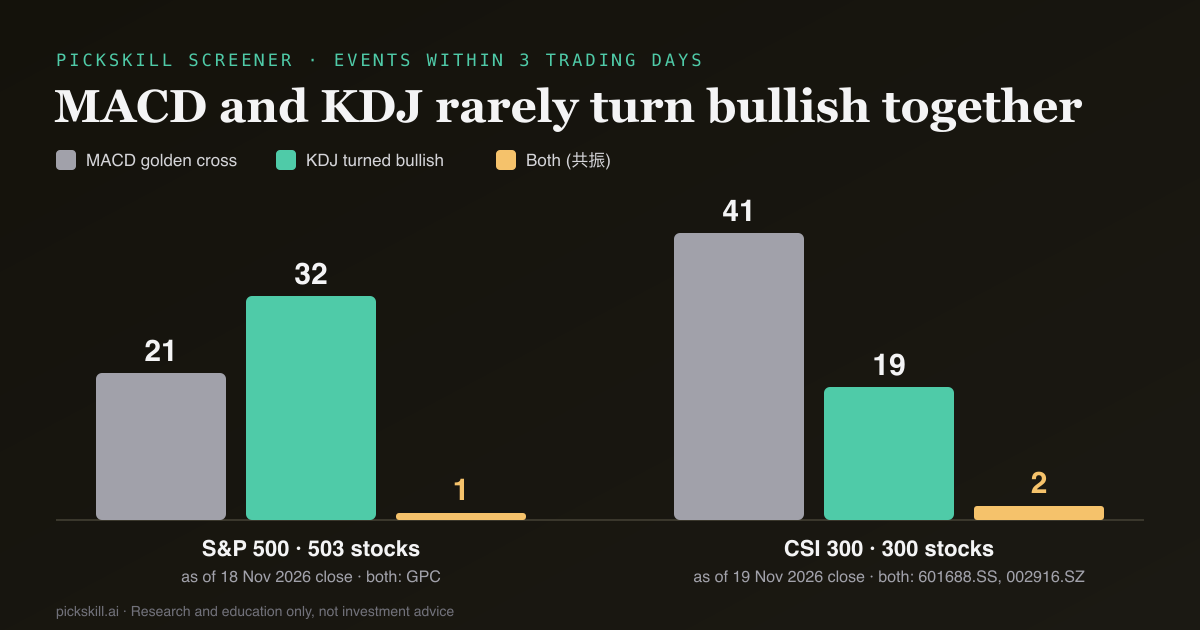
| Universe (as of close) | Screened | MACD golden cross ≤ 3d | KDJ turned bullish ≤ 3d | Both | Both, 5-day window |
|---|---|---|---|---|---|
| S&P 500 (18 Nov 2026) | 503 | 21 (4.2%) | 32 (6.4%) | 1 — GPC | 2 — GPC, DXCM |
| CSI 300 (19 Nov 2026) | 300 | 41 (13.7%) | 19 (6.3%) | 2 — 601688.SS, 002916.SZ | 2 (same) |
Three things stand out. First, overlap is rare: across 803 stocks, only 3 had both signals within 3 sessions, roughly 5% of the MACD crosses in each index. Second, the two indicators rarely fire together because they fire at different times; KDJ usually turns first, and by the time MACD crosses, K is often already above 50, which PickSkill does not count as a fresh bullish KDJ cross. Third, all three overlap names (Genuine Parts, Huatai Securities, Shennan Circuits) crossed with DIF still below zero, for example GPC at DIF −1.26 versus DEA −1.30. That makes them early rebound signals inside a weak trend, not confirmed uptrends. These are one-day counts, not a backtest, and not a view on any named stock.
When should you use MACD and when should you use KDJ?
Use MACD when the question is about direction: is this stock in an uptrend, is the trend gaining or losing momentum, and is a pullback over? It works best on names that trend for weeks. Use KDJ when the question is about timing inside a range: is price near the bottom or the top of its recent band, and is the short-term swing turning? A flat DIF near zero favours KDJ-style range trading; a rising DIF well above zero favours MACD-style trend following. On PickSkill's indicator pages both dimensions sit side by side with a 5-day signal trail, so you can see which one moved first.
How do you combine MACD and KDJ?
The common A-share routine is "MACD for direction, KDJ for timing", and the 共振 (resonance) idea adds a time window for both to agree. A workable version:
- Set direction with MACD. Only look for long setups when DIF is above DEA, or better, above the zero line. Skip KDJ buy signals when MACD is falling below zero.
- Wait for KDJ to pull back. In an uptrend, let K and D drop toward 20–50 instead of chasing readings above 80.
- Time the entry with a KDJ golden cross. A K/D cross in that lower zone, in the MACD direction, is your timing trigger.
- Treat a same-window cross as 共振. If a MACD golden cross and a KDJ bullish turn land within 3–5 sessions of each other, flag it as a higher-priority candidate; our screen shows this happens to well under 1% of stocks on a given day.
- Check where MACD crossed. A cross above zero confirms an existing trend; a cross below zero is a rebound attempt and deserves a tighter stop.
- Exit on the faster signal. A KDJ death cross from above 80 is an early warning; a MACD death cross confirms that momentum has turned.
You can run step 4 directly: in the screener, add a "MACD golden cross within 3 days" event and a "KDJ turned bullish within 3 days" event to the same query. To confirm a single cross further, see How to Confirm a MACD Golden Cross, or ask the PickSkill AI analyst to read all 8 dimensions for one ticker.
Why is KDJ so popular in China?
KDJ is a standard sub-chart in Chinese trading software, next to MACD and volume, so most A-share retail traders see it daily. It also suits the market: many names swing inside ranges for long stretches, and daily price limits of ±10% on the main boards (±20% on ChiNext and STAR) create sharp short bursts that a 9-day oscillator registers quickly. US platforms usually show the Western stochastic oscillator (%K and %D, without J) instead. The settings carry across markets, but long halts are a special case: if the whole 9-day window has no high-low range, RSV is undefined, and PickSkill's engine holds K and D at their previous values rather than dividing by zero. Our post on MACD on A-shares vs US stocks covers more of these market-structure differences.
This post is for research and education only, not investment advice.
FAQ
Is KDJ or MACD better for short-term trading? KDJ is usually better for short-term timing because it uses a 9-day high-low range and reacts within one to three sessions. MACD is slower and better at telling you whether the broader trend supports the trade. Many traders still check MACD's direction first and take KDJ crosses only in that direction.
What does MACD and KDJ 共振 (resonance) mean? 共振 means both indicators give the same signal within a short window, typically a MACD golden cross and a KDJ golden cross within three to five trading days. It is treated as stronger than either signal alone because a slow trend indicator and a fast range indicator agree. In our 18–19 Nov 2026 screen, only 3 of 803 S&P 500 and CSI 300 stocks met this condition within 3 sessions.
What are the standard settings for MACD and KDJ? MACD's standard settings are 12, 26 and 9: a 12-day and 26-day EMA of closes, and a 9-day EMA of their difference as the signal line. KDJ's standard settings are 9, 3 and 3: a 9-day range for RSV, then two 3-period smoothings for K and D, with J = 3K − 2D.
Why does KDJ give so many false signals in a trend? In a strong trend, the close keeps landing near the top (or bottom) of the 9-day range, so K and D stay above 80 (or below 20) for weeks. This is called passivation, or 钝化. Overbought or oversold readings then describe trend strength rather than an imminent reversal. Pairing KDJ with a trend filter such as MACD's zero line avoids trading against it.
Can I screen for stocks where MACD and KDJ both turned bullish? Yes. In the PickSkill signal screener, add an event condition for a MACD golden cross within N days and a second event for KDJ turned bullish within N days; conditions are combined with AND. The screener covers about 950 US, Hong Kong and China A-share stocks and refreshes after each market close. Pro and Power plans see the matches; Free accounts see the match count.