How to Screen Oversold S&P 500 Stocks (RSI < 30)
15 of 503 S&P 500 stocks had RSI(14) under 30 on 18 Nov 2026; only 2 also had a MACD golden cross. How to run the screen and which filters cut false signals.
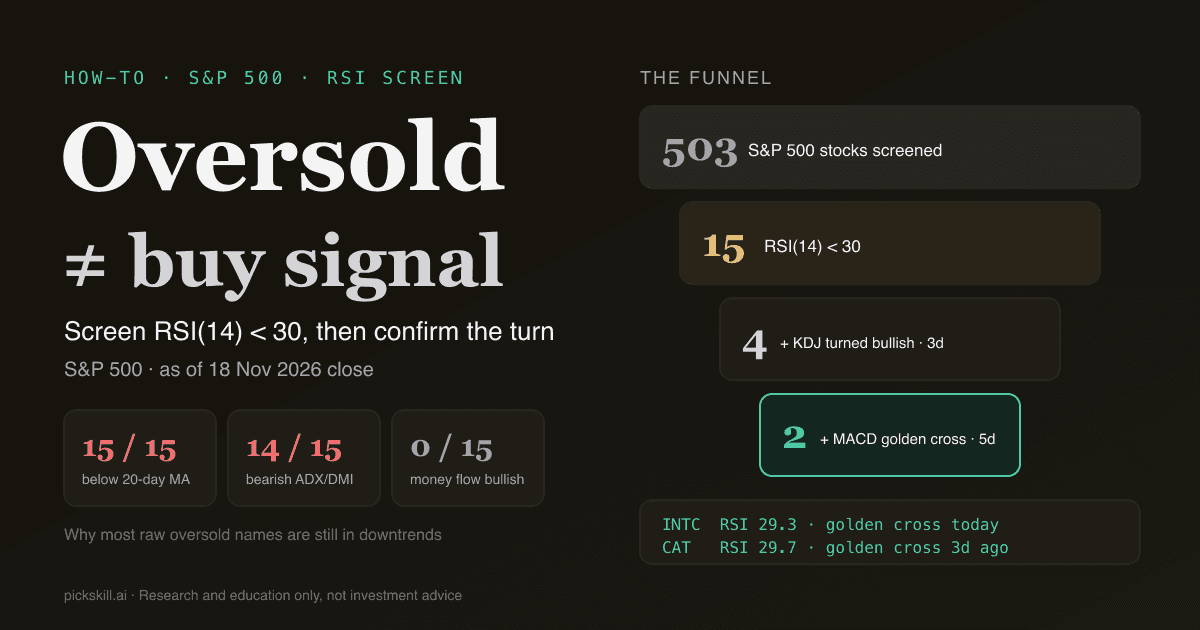
To screen oversold S&P 500 stocks, filter the index's members for RSI(14) below 30, sort by lowest RSI, then add one confirmation condition, such as a MACD golden cross in the last 5 days, before you treat any name as a candidate. An oversold stock is one whose 14-day RSI has fallen below 30, the threshold J. Welles Wilder set in 1978, which means recent losses have heavily outweighed recent gains. As of the 18 Nov 2026 close, 15 of 503 S&P 500 stocks screened in PickSkill had RSI(14) under 30, and only 2 of those 15 also had a MACD golden cross within 5 trading days.
That gap is the point of this guide. A raw RSI < 30 list mostly finds stocks that are still falling. Confirmation filters shrink it to the few where momentum has started to turn. For the general, any-market version of this workflow, see how to find oversold stocks in 60 seconds; this post is specific to the S&P 500 and to the confirmation step.
Key takeaways
- Raw screen: 15 of 503 S&P 500 stocks had RSI(14) < 30 on 18 Nov 2026, led by NVIDIA (21.1), Salesforce (24.1) and ServiceNow (25.6).
- Most were in strong downtrends: all 15 closed below their 20-day average, and 14 of 15 showed a bearish ADX/DMI reading, the setup in which RSI misleads most often.
- MACD confirmation cut the list to 2: Intel (golden cross on 18 Nov) and Caterpillar (golden cross 3 sessions earlier).
- Money flow confirmation cut it to 0: none of the 15 had positive 5-day and 20-day money flow.
- The screen takes about a minute in PickSkill's /screener: pick US, tick S&P 500, click "Oversold · RSI < 30", add one event condition, run.
What does "oversold" mean for an S&P 500 stock?
An S&P 500 stock is called oversold when its 14-day Relative Strength Index drops below 30. RSI compares the size of recent up days with recent down days on a 0–100 scale. Wilder introduced it in New Concepts in Technical Trading Systems (1978) with a 14-period default and 70/30 overbought/oversold lines, as StockCharts' ChartSchool summarises. Below 30 means sellers have dominated the last few weeks to an unusual degree. It does not mean the stock is cheap, and it does not mean selling is finished. In a large-cap index like the S&P 500, readings under 30 are relatively uncommon on any given day: on 18 Nov 2026 they applied to about 3% of members (15 of 503), versus 11 members above 70. For the full mechanics, read what is RSI.
Which S&P 500 stocks were oversold on 18 Nov 2026?
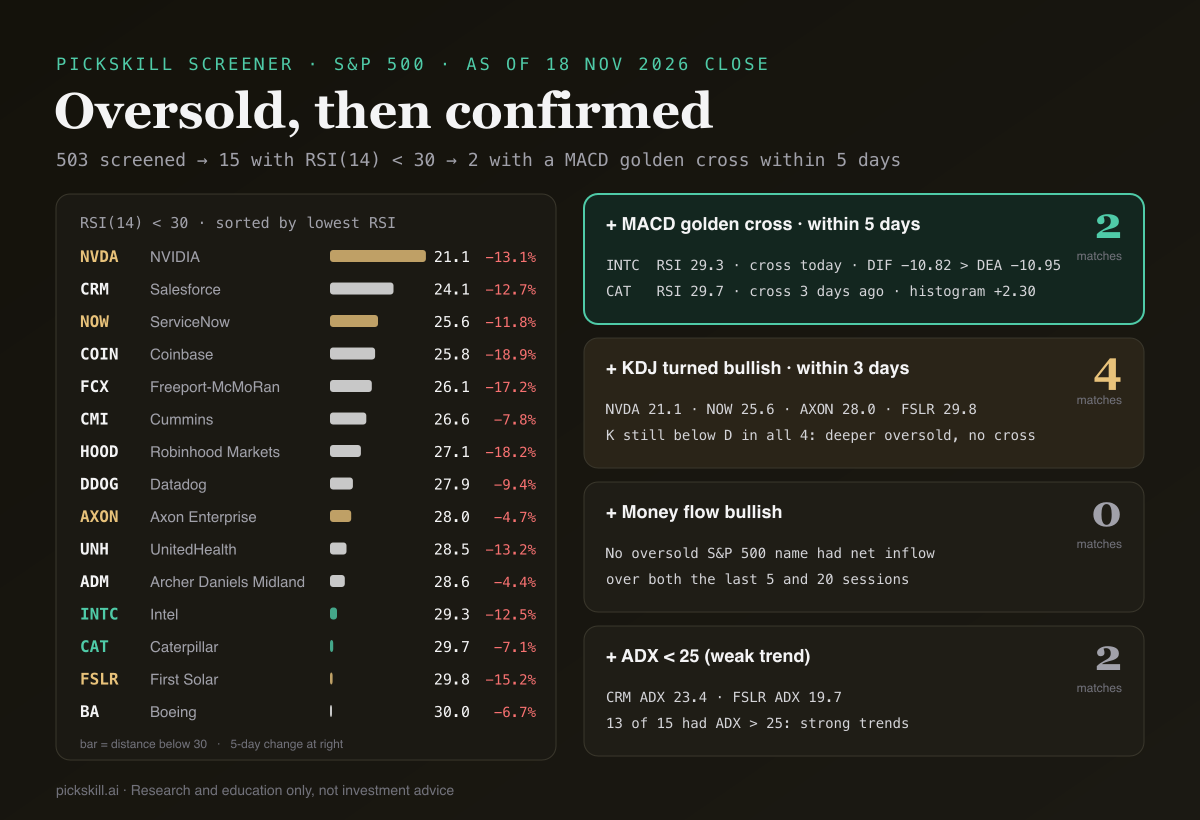
Fifteen S&P 500 stocks had RSI(14) below 30 at the 18 Nov 2026 close, out of 503 screened with no missing data. The list was concentrated in software (Salesforce, ServiceNow, Datadog), crypto-linked brokers (Coinbase, Robinhood), industrials (Cummins, Caterpillar, Boeing) and semiconductors (NVIDIA, Intel). The median 5-day move across the 15 was −12.5%, ranging from −18.9% (Coinbase) to −4.4% (Archer Daniels Midland). Only NVIDIA and Axon had been oversold on all of the last five sessions; six names (FCX, UNH, ADM, CAT, FSLR, BA) dropped below 30 on 18 Nov after sitting above it the session before. Data comes from PickSkill's signal table, refreshed after each US close; nothing below is a recommendation.
| Stock | Close | 5-day | RSI(14) | ADX | Confirmation on 18 Nov |
|---|---|---|---|---|---|
| NVIDIA (NVDA) | $150.96 | −13.1% | 21.1 | 47.1 | KDJ bullish (K 12.5, D 15.4) |
| Salesforce (CRM) | $190.40 | −12.7% | 24.1 | 23.4 | none |
| ServiceNow (NOW) | $90.59 | −11.8% | 25.6 | 41.1 | KDJ bullish |
| Coinbase (COIN) | $110.51 | −18.9% | 25.8 | 37.3 | none (KDJ bullish 5 days, no flip) |
| Freeport-McMoRan (FCX) | $51.45 | −17.2% | 26.1 | 28.6 | none |
| Cummins (CMI) | $427.16 | −7.8% | 26.6 | 47.5 | none (KDJ bullish 5 days, no flip) |
| Robinhood (HOOD) | $69.17 | −18.2% | 27.1 | 33.0 | none |
| Datadog (DDOG) | $167.11 | −9.4% | 27.9 | 38.8 | none (KDJ bullish 3 days, no flip) |
| Axon (AXON) | $300.69 | −4.7% | 28.0 | 40.0 | KDJ bullish |
| UnitedHealth (UNH) | $349.91 | −13.2% | 28.5 | 25.3 | none |
| Archer Daniels Midland (ADM) | $67.78 | −4.4% | 28.6 | 34.6 | none |
| Intel (INTC) | $54.67 | −12.5% | 29.3 | 43.0 | MACD golden cross today |
| Caterpillar (CAT) | $558.77 | −7.1% | 29.7 | 40.0 | MACD golden cross 3 days ago |
| First Solar (FSLR) | $150.98 | −15.2% | 29.8 | 19.7 | KDJ bullish (first day) |
| Boeing (BA) | $162.91 | −6.7% | 30.0 | 32.4 | none |
Source: PickSkill screener, S&P 500, RSI(14) < 30, sorted by lowest RSI, as of 18 Nov 2026 close. Boeing's RSI was 29.96.
Why is an RSI below 30 not a buy signal on its own?
RSI below 30 is not a buy signal on its own because momentum oscillators can stay oversold for weeks while a downtrend continues. ChartSchool says it directly: oscillators "can become overbought (oversold) and remain so in a strong up (down) trend." The 18 Nov list shows why that matters. All 15 stocks closed below their 20-day moving average, 14 of 15 had their 20-day average below the 60-day, 14 of 15 had a bearish ADX/DMI reading (ADX at least 20 with −DI above +DI), and 13 had ADX above 25, the usual mark of a strong trend. NVIDIA is the textbook case: RSI 21.1, oversold five sessions running, ADX 47.1, and the close about 20% below its 20-day average of $189.04. An oversold reading inside a trend that strong describes how hard the stock is falling, not where it stops. Our what is RSI guide covers this failure mode in detail.
Which confirmation filters reduce false oversold signals?
The confirmation filters that reduce false oversold signals are the ones that measure something RSI does not: a momentum turn (MACD golden cross), a second oscillator (KDJ), buying pressure (money flow) or trend strength (ADX). Each one is added as an extra AND condition, so the list can only shrink. The table shows what each did to the 15-stock list on 18 Nov 2026. The pattern is consistent with the approach in our 3-indicator filter post: pair a momentum oscillator with a trend tool rather than stacking oscillators that say the same thing.
| Confirmation added to RSI < 30 | Screener condition | Matches | Names | What it tells you |
|---|---|---|---|---|
| None (raw screen) | Value: RSI < 30 | 15 | see table above | Selling has been heavy |
| MACD golden cross | Event: MACD golden cross within 5 days | 2 | INTC, CAT | Short-term momentum has turned up |
| KDJ turned bullish | Event: Turned bullish on KDJ within 3 days | 4 | NVDA, NOW, AXON, FSLR | A second oscillator agrees; not a turn yet |
| Money flow bullish | Signal: Money flow is Bullish | 0 | none | Buyers have not returned on net |
| Weak trend | Value: ADX < 25 | 2 | CRM, FSLR | Oversold in a range, where RSI works better |
Three things stand out. First, the MACD filter is the only one that captured an actual momentum turn: Intel's DIF (−10.82) crossed above its DEA (−10.95) on 18 Nov, and Caterpillar's cross came three sessions earlier with the histogram now at +2.30. Both crosses happened below zero, which is an early, lower-conviction turn; confirming a MACD golden cross explains what to check next. Second, the KDJ filter is weaker than it looks. PickSkill marks KDJ bullish either on a K-over-D cross below 50 or when K and D are both under 20. For all four matches K was still below D, so the "turn" came from sliding deeper into oversold, not from a cross. Third, zero money-flow matches is information too: no oversold S&P 500 name had net buying over both the last 5 and 20 sessions.
How do you screen oversold S&P 500 stocks in PickSkill?
You screen oversold S&P 500 stocks in PickSkill by opening the Signal Screener, restricting the universe to S&P 500 members, applying the oversold quick screen and adding one confirmation condition. The screener covers about 950 stocks across the S&P 500, Nasdaq-100, Hang Seng and CSI 300, evaluates up to 8 conditions that must all match, and refreshes after each market close. Every match lists the evidence for each condition, so you can see the exact RSI value and how many days ago a cross happened. More detail is on the stock screener feature page.
- Open /screener and sign in.
- Set the universe. Under Market, choose US. Under Index, tick the S&P 500 chip. Leave the other chips off so Nasdaq-100 names outside the S&P 500 don't slip in.
- Apply the quick screen. Under Quick screens, click Oversold · RSI < 30. This adds the condition "Value: RSI < 30" and sorts by Lowest RSI.
- Add a confirmation. Click Add condition, choose Event, then MACD golden cross within 5 days. For the KDJ variant, choose Turned bullish on KDJ within 3 days. For money flow, choose Signal: Money flow is Bullish.
- Click Run screen. The header reads "{matched} of {screened} stocks match" with "Signals as of" the last close. Check that date before you read anything else.
- Open each match. Use Signal page for the full 8-dimension read with its 5-day trail, or Ask AI about these results to have the AI analyst compare trend, valuation and risks.
The screener is a Pro feature (the plan comparison also lists it on Starter and Power). On the Free plan you can build the same screen and see how many stocks match, but names, prices and signal pages stay locked. See pricing for the 7-day trial on a first plan.
How should you read the stocks that pass the confirmation?
Treat a stock that passes RSI < 30 plus a confirmation as a research candidate, not a trade. Intel and Caterpillar both passed the MACD filter on 18 Nov 2026, yet both still had bearish moving-average and money-flow readings and ADX near 40 to 43, so the larger downtrend was intact. A sensible next step is to check whether the turn holds for several sessions: the MACD trail for Caterpillar flipped between neutral and bullish over the last five days, which is the kind of flicker the 5-day signal trail is designed to expose. Then look at what drove the selloff, using earnings, guidance or sector news, before deciding anything. You can open each stock's free signal page, for example Intel, Caterpillar or NVIDIA, or browse every member on the S&P 500 hub.
Research and education only, not investment advice.
FAQ
How many S&P 500 stocks are oversold right now? On the 18 Nov 2026 close, 15 of 503 S&P 500 stocks screened in PickSkill had a 14-day RSI below 30, about 3% of the index. The count changes every session, so rerun the screen after each US close and check the "Signals as of" date in the results header before using the list.
What is the best confirmation filter for an RSI oversold screen? A momentum-turn filter such as a MACD golden cross within the last 5 days is usually the most informative, because it measures something RSI does not. On 18 Nov 2026 it reduced 15 oversold S&P 500 stocks to 2. Money flow and trend strength (ADX) are useful second checks.
Should I use RSI below 30 or below 35 for S&P 500 stocks? RSI below 30 is Wilder's original threshold and gives a short list. Loosening to 35 widens it: on 18 Nov 2026, RSI below 35 plus a MACD golden cross within 5 days matched 5 S&P 500 stocks instead of 2. Looser thresholds catch more turns earlier but include weaker oversold readings.
Is the PickSkill screener free? The screener is a paid feature listed with Pro. Free users can build any screen and see how many stocks match, but the matching names, prices, signal pages and AI analysis unlock on a paid plan. Your first paid plan starts with a 7-day free trial.